2026-06-17 19:16:04
I am a fan of AI councils. As many readers will know (from previous posts), I use AI expert panels every day to deliberate on hard questions, challenge my thinking, and do research.
These AI councils, or panels, start from an assumption that a group can produce better work than a single agent. My friend and one of the sharpest AI practitioners out there, , tested this hypothesis.
I thought Rohit’s experiment was genuinely useful for anyone thinking of designing or already working with AI councils, so I asked him to share the findings with us today.
Over to Rohit.
– Azeem
By Rohit Krishnan, originally published on Strange Loop Cannon
One way to get the best out of LLMs is to use model diversity. The models are not all the same so if you use their unique natures, you can get better responses. We saw it with the work on MarketBench. And we also saw this when Karpathy came up with LLM Council as a way to get multiple models to work with each other and get us a better answer.
But I started wondering, with people, when you put a bunch of them together in a committee, some things get better but some things do get worse! And relying on an LLM to audit is also error-prone. “Design by committee” is a four letter word for a reason. LLMs are better than us probably, but surely this process is also somewhat lossy. So what do we lose?
To test it, I set up an experiment, where I set up a few committees of models:
First, I took each answer, then gave those to a fourth model and asked it to write the final version.
Then, the llm-council – essentially peer review and then a chairperson summarises
And a “best answer” picker – just a direct pick.
With people, the problem with committees is that they “smooth out” all idiosyncrasies. They take out any “spiky” points of view, and make things much more normie. Same thing here. So to test how we do I had to find some way to grade how the various final responses were. I broke each answer into small “cards” using Sonnet. A card could be a mechanism, observation, metric, failure mode, image, or some other important detail.
Then I clustered cards that appeared to mean the same thing. If a cluster appeared in one solo answer, we called it a single-model idea. If it appeared in more than one, it’s shared. And two judges scored the solo-derived clusters without knowing which model produced them or whether a council kept them.
Now, it’s not perfect, but it’s the cleanest way to test the problem of “how to rate which answer is better” that I could find without doing human ratings.
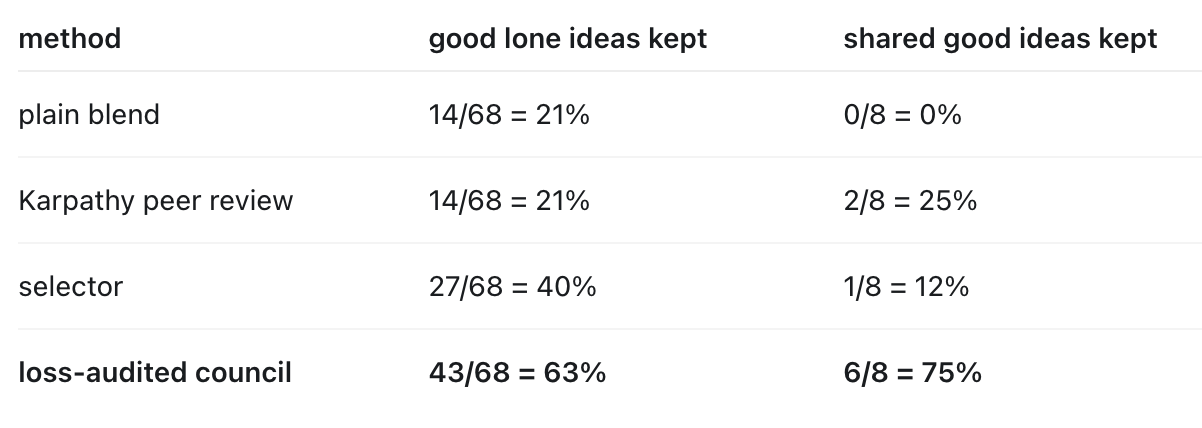
First, the result: the council does not simply keep the best bits from everyone. It keeps a minority of the good ideas, while peer review seems to give consensus ideas an extra push.
Obviously, the final summarized versions usually read better. It is calmer, more complete, less jagged, all things you’d expect. But we had misses. Examples.
A field report noticing that salvaged retail scent cartridges had become status symbols in a squatted mall, used to mask the smell of communal living.
An incident report arguing that logged-but-deprioritized risks are more dangerous than unknown ones, because they manufacture a false sense of control.
A data-recovery plan that asks users to re-confirm suspect fields at their next login (”please re-confirm your shipping address”), quietly crowdsourcing recovery from the one authoritative source.
In the final runs, the blended council kept only about a quarter of the good ideas that appeared in just one model’s answer. Remember, these were ideas that two blind judges rated as useful, non-obvious, and worth keeping, and still roughly three quarters did not make it into the final answer.
The peer-review version did not solve this either. The rare ideas survived at about the same rate as in plain blending: 24% versus 22%. But if several models had raised the same idea, the peer-review council kept it about a third of the time, but if only one model raised it, a quarter.
To test this, I ran sixteen open-ended prompts: eight strategy problems and eight writing tasks.
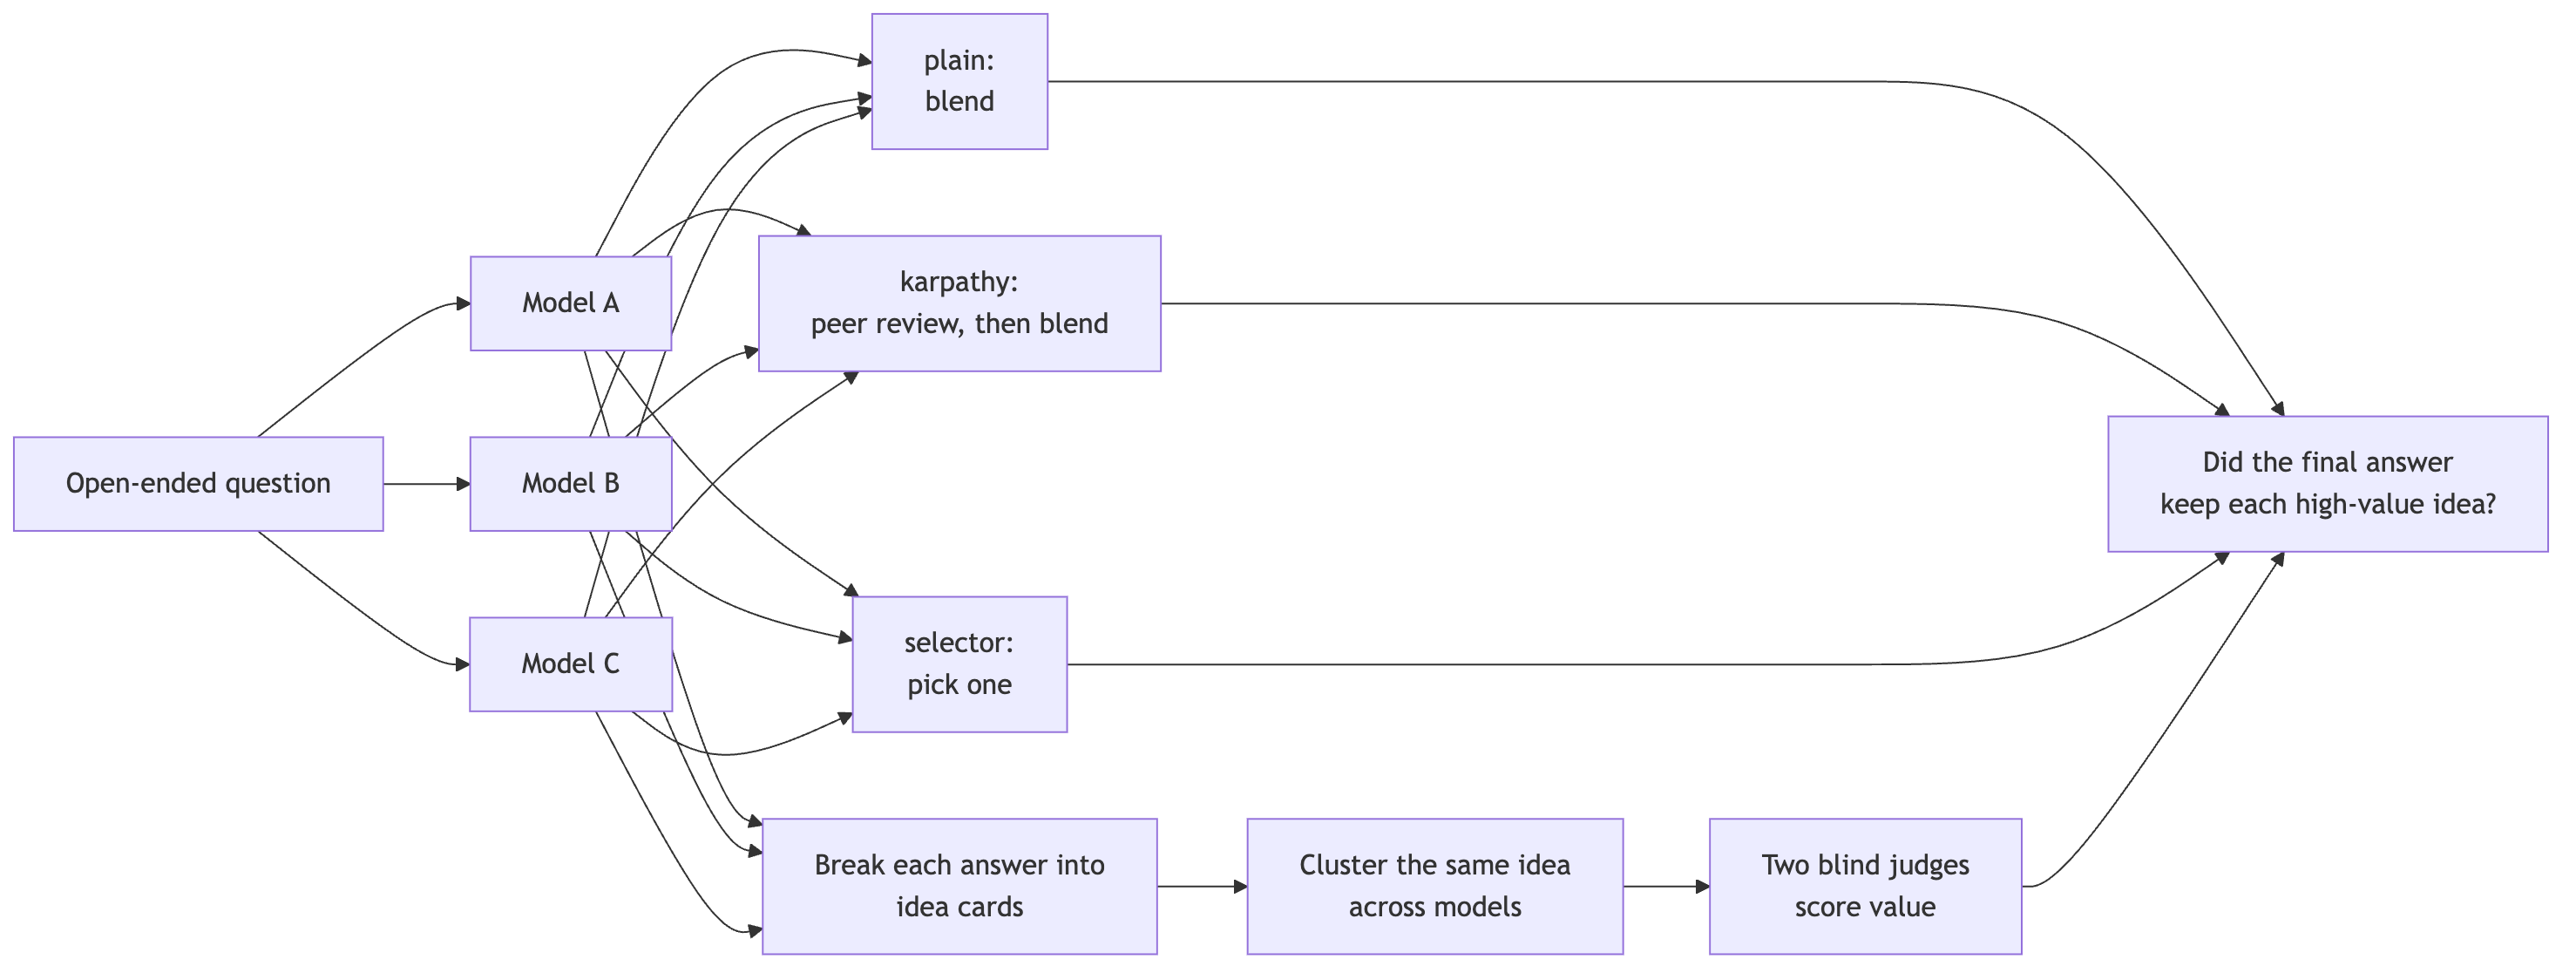
Figure 1. The experiment path from solo answers to idea coverage.
I plotted what happened with the ideas. The red dot below is good idea that only one model came up with. Blue is good ideas that multiple models came up with. And the X-axis shows how many of each actually showed up in the final answer. So the selector for instance showed about 37% of all good single-model ideas, and 24% of the multiple-models ideas, which makes sense because it picks one full answer and discards the others.
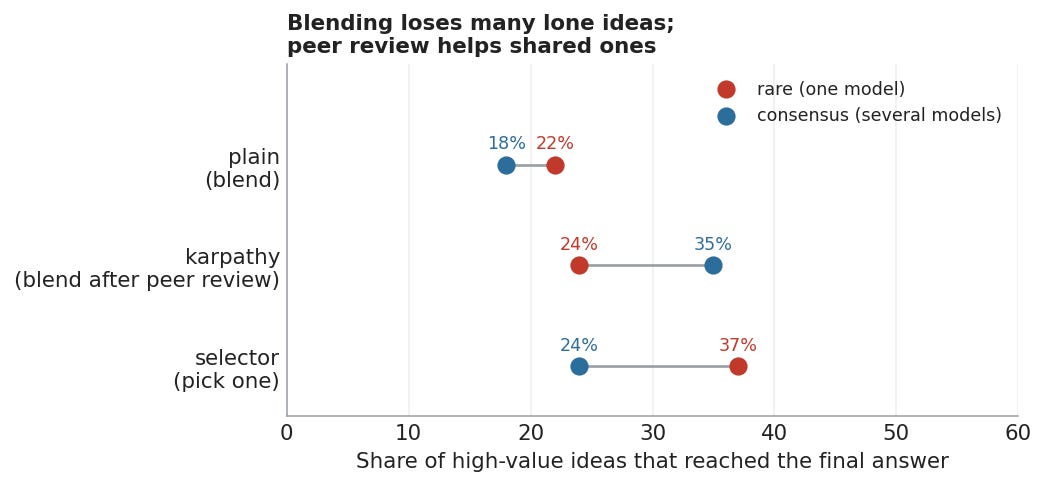
Figure 2. Coverage of blind-rated high-value ideas.
The consensus tilt is smaller here, but interesting. In the peer-review council, shared high-value ideas that survived had an 11% uplift over single-model high-value ideas. Or put another way, a 50% relative lift!
The denominator for shared ideas is small, though. What’s interesting is that this shows us how the specific topology of the “council” changes what you’re likely to get, like a peer-review round ends up becoming a consensus detector even above a single model blending the answers from all other models.
This is a problem with all cognitive beings. In group decision-making research, back in the 1980s, Stasser and Titus called it biased sampling of shared information - groups are more likely to discuss information that several members already know than information that only one has. That line of work led to the “hidden profile” problem, where a group can miss the best answer because the crucial evidence is scattered across individuals rather than shared up front. We’re seeing the same thing here.
The work on LLMs, meanwhile, so far has mostly come from the other direction. Multi-agent debate papers ask whether multiple models can improve the final answer, and yes, they often can! But depending on the topic and the question, a council can absolutely improve the average answer and still drop some of the best ideas.
As users, we want to get better answers, cheaply. That’s the whole goal. Councils are great ways to make some answers better depending on how you structure it. But they’re not cheaper. So it is important to make sure they are actually better! If they’re not, or at least not universally, then how the council should be structured is an incredibly important problem!
What we still see here is that there is no free token lunch. If you use councils to get the benefits of model diversity, don’t assume it will preserve the best ideas. To do that we have to work harder, and understand how to work with these models.
For instance, one thing we know is that the best way with LLMs usually is to be explicit, since otherwise, even if they’re aligned, they cause emergent problems. So the best protocol might be to explicitly gather and store the best ideas from each solution separately and ensure they’re stored, ranked and assessed, before a final answer is written and revised.
It does much better, though it’s slower and heavier. I don’t know if this is the best we can do. The structure might change depending on the question asked, the domain, or the types of answers expected.
Humans have gone through thousands of types of “councils” until we reached interim solutions which give us decent results nowadays. And even then, we have to change the shape of the councils constantly, as we evolve, and society evolves.
To figure out how to get the best results from our work requires a lot more effort into designing the councils. If you’re working with them, you will need to experiment and eval against your individual problem sets, which is the only way to know if this specific council setup will help with your specific problem. Copying someone else’s homework won’t work!
Homo Agenticus are odd enough creatures that using them well requires much, much more experimentation than one might assume. Especially when the problems of using them suboptimally is that we lose actual functionality, often without knowing it!
This essay was originally published in Rohit’s publication Strange Loop Cannon.
2026-06-15 22:36:13
Hi all,
Here’s our Monday roundup of data signals across AI, energy and markets.
Enjoy!
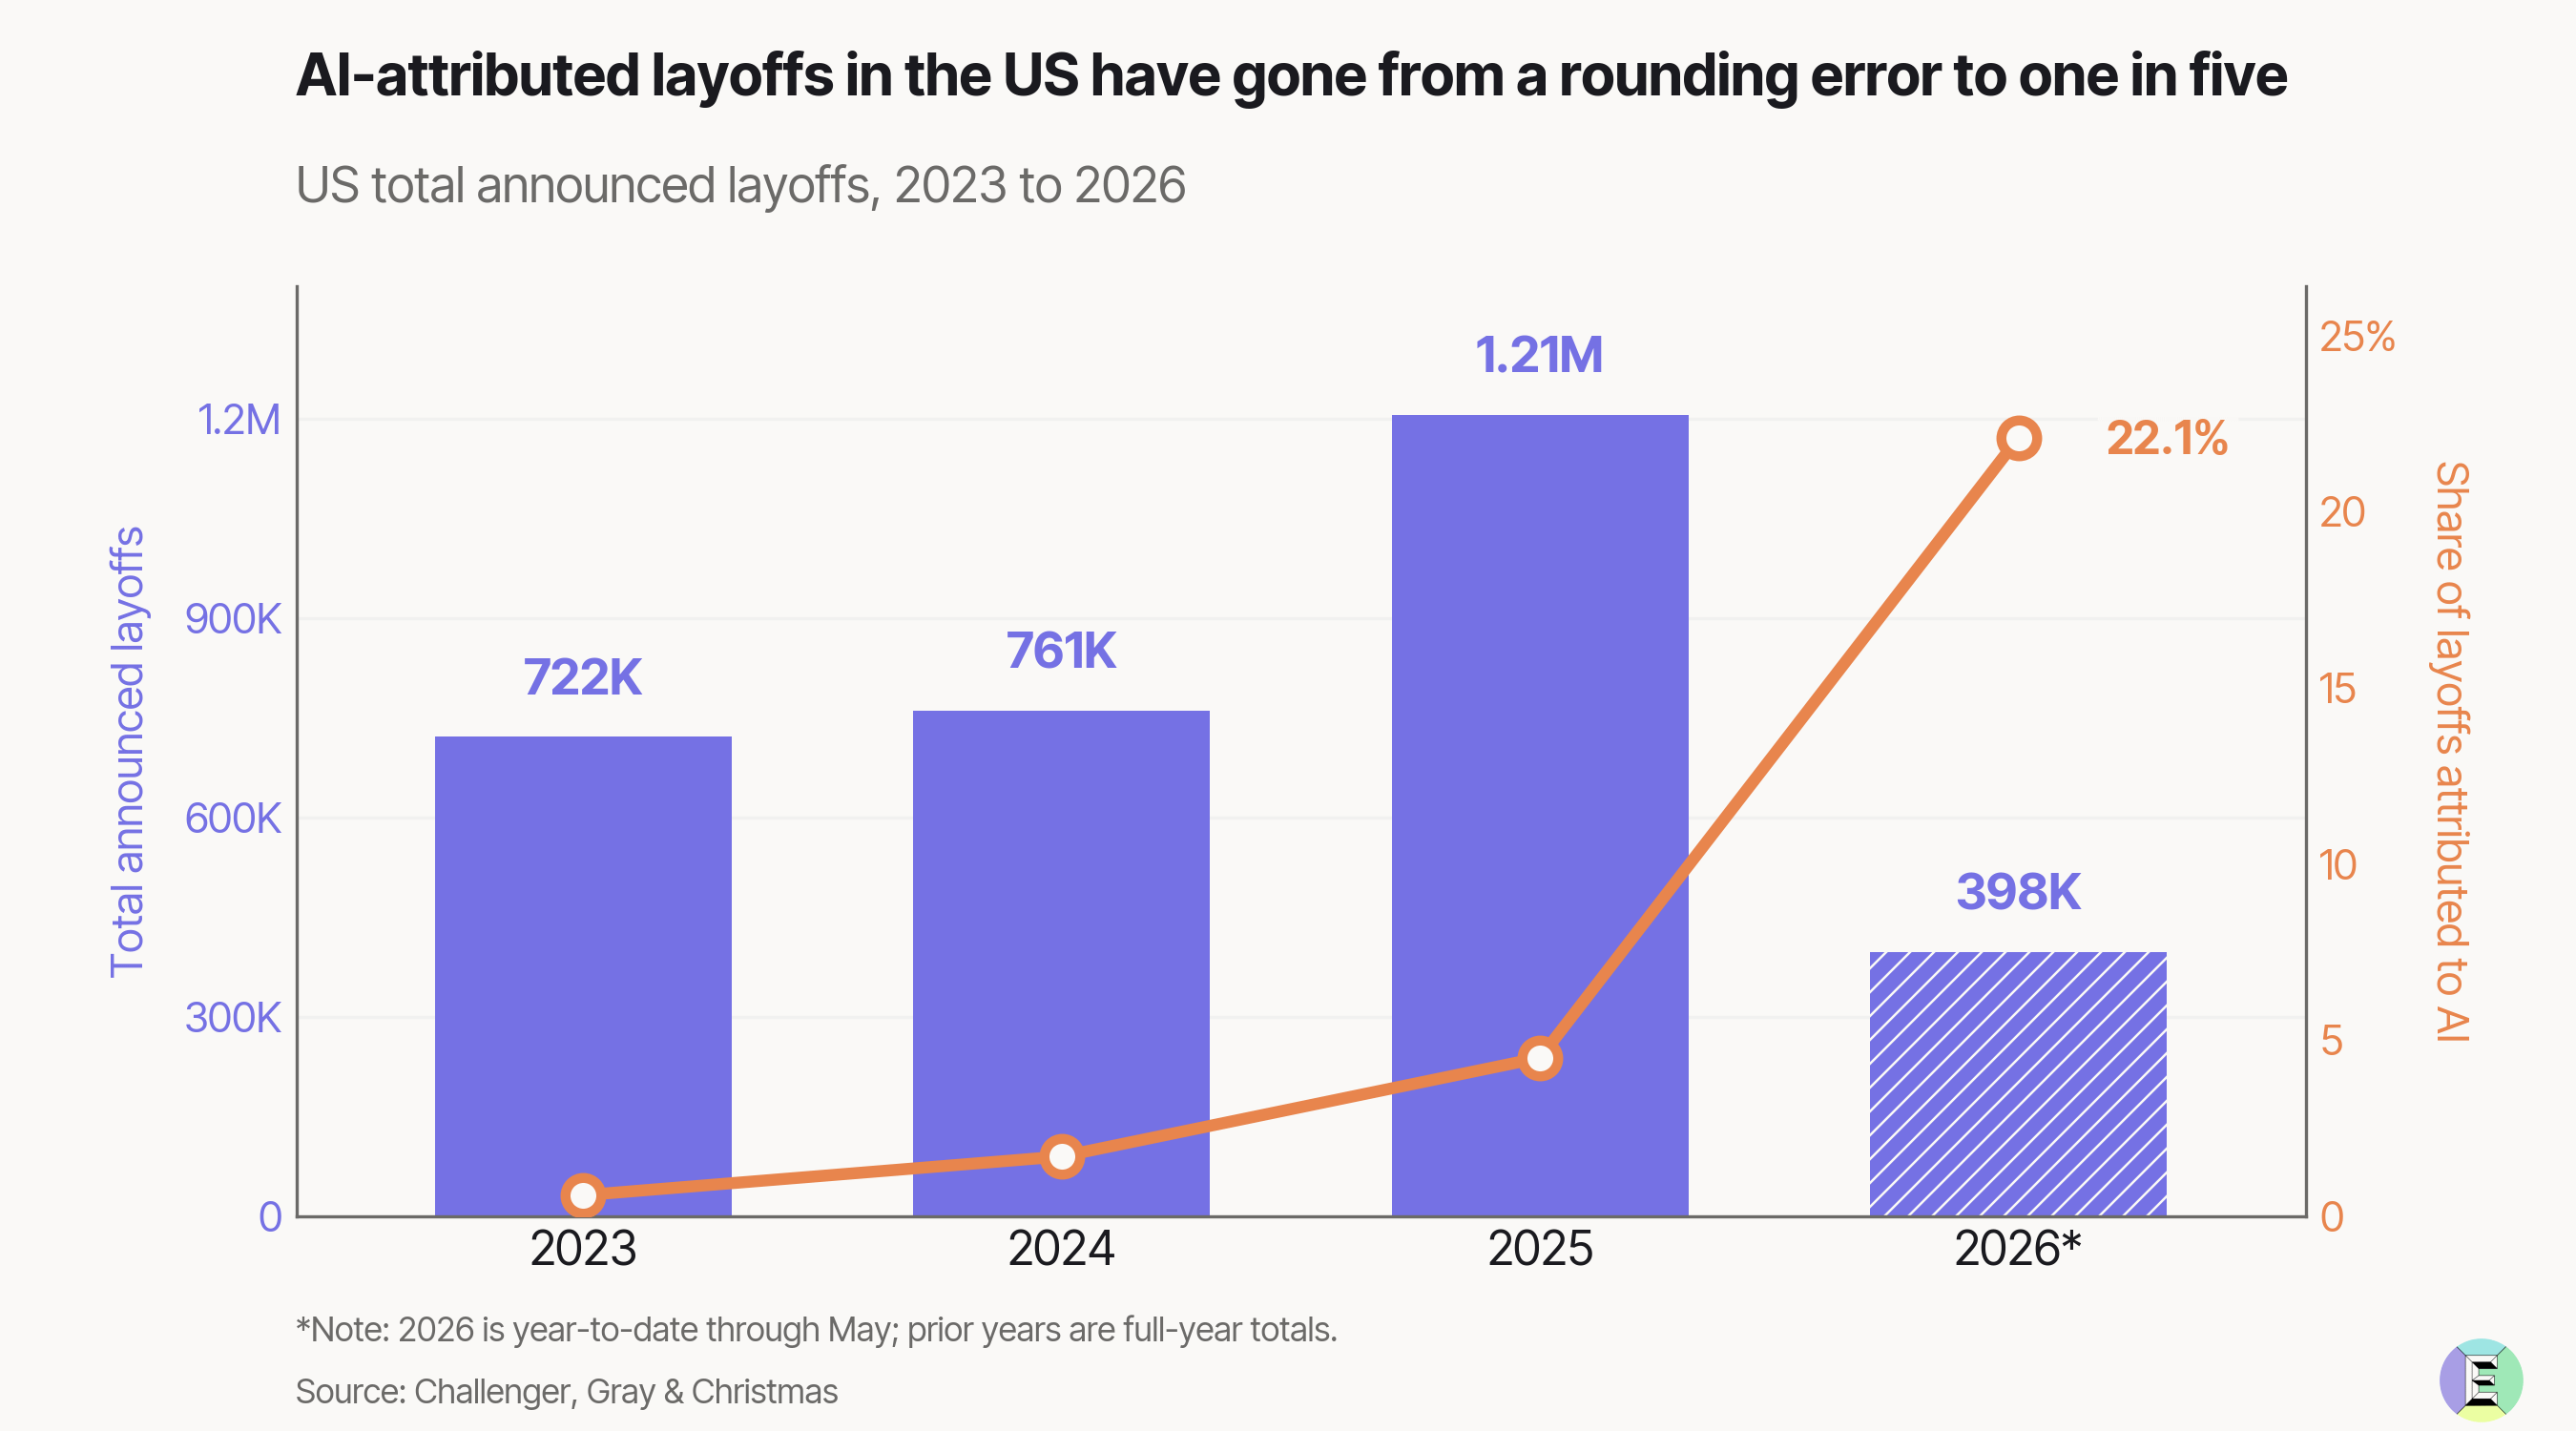
AI & jobs. AI was cited as the top reason for nearly 40% of US job cuts in May1.
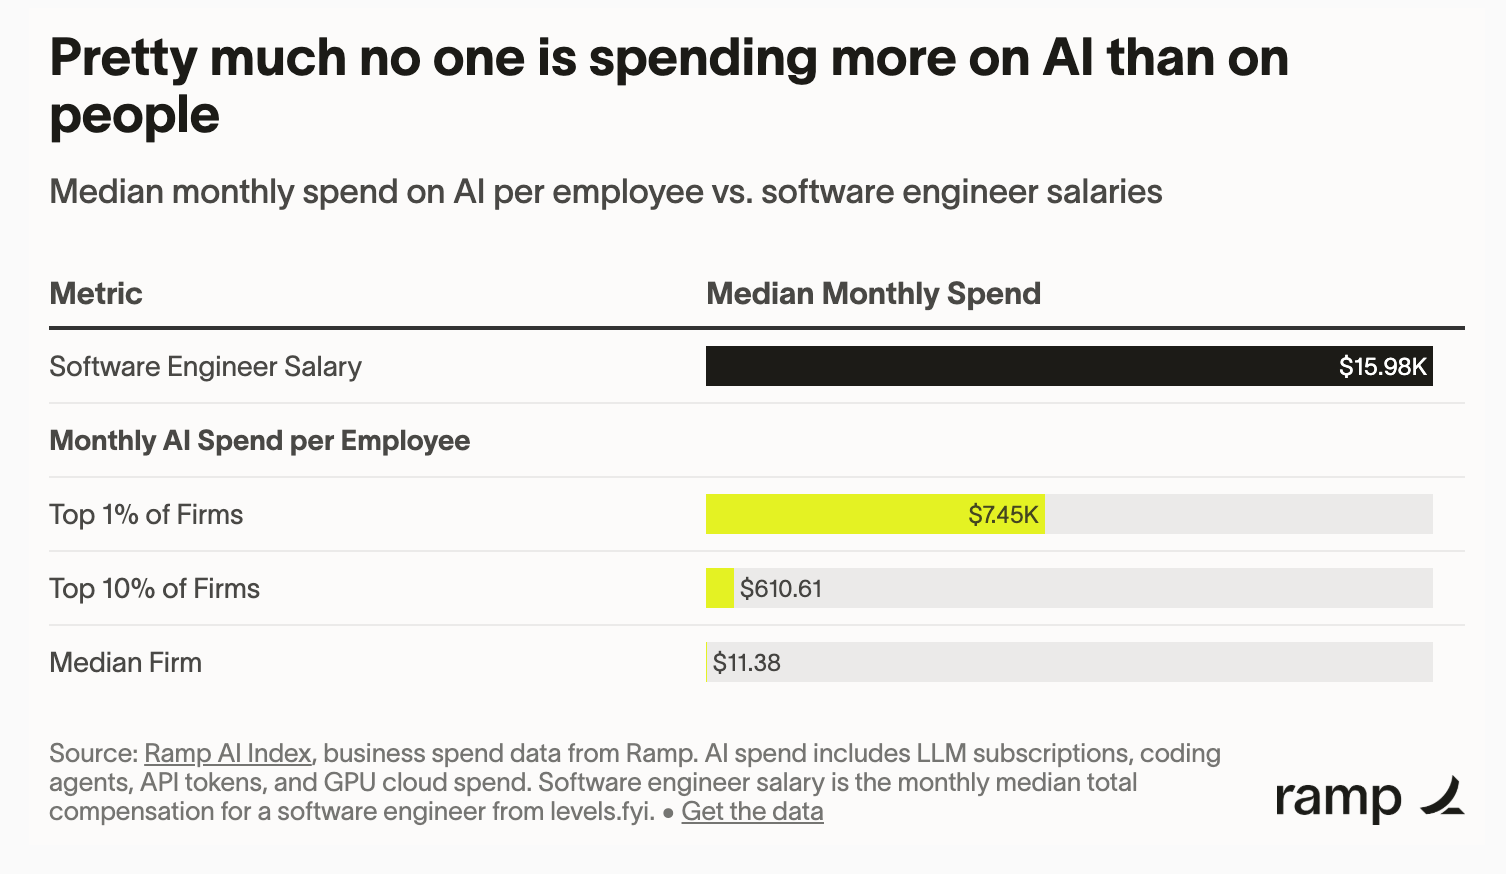
Mind the gap. The top 1% of US firms spend $7,450 per employee on AI each month, roughly 650x the typical firm’s $11.38.
AI productivity guarantee? Cognition says they will fund up to $10 million in credits if their AI agents fail to deliver the engineering value enterprise customers paid for.
2026-06-14 11:30:55
Hi all,
I sent a note on Thomas Piketty’s blueprint for global justice to members of Exponential View yesterday. I call its recommendations a “blueprint for managed decline”. The commentary touches on the future of modernity, scientific dynamism and democratic legitimacy. Read it here.
In today’s Sunday briefing, we look at:
The iPhone reduced fertility; what will AI do?
What’s driving the consensus behind pausing AI development?
The largest solar factory, gene therapy for rejuvenation & Chinese Gen Z finds inspiration in Western memes++
But, first…
, Sam Altman, Donald Trump and Vinod Khosla all agree that the public should own a slice of AI. Bernie proposes transferring 50% of ownership of leading AI companies into a sovereign wealth fund; Trump is supportive; Sam agrees in principle but pushed back on the 50%; and Vinod wrote an op-ed in the FT advocating for a new tax code on wealth AI creates and eventually pooling it into a sovereign wealth fund:
A sovereign fund with ownership of AI companies makes every American a capital owner, not a bystander to the AI economy.
The same day the Senate held a hearing on AI, Anthropic published a framework that has sovereign wealth funds as one of the mechanisms to deploy in case of the worst-case scenario, when “[t]he search for work stretches past a year, then past two, and for some, eventually stops”.
The core assumption here is that AI will tilt the economy’s income from labor to capital. We don’t have evidence that this is happening yet and we may not know for a long time.
Vinod believes that AI will be capable of doing 80% of jobs by 2030 and that $15 trillion of US GDP, which is labor compensation, will mostly disappear. Economist Chad Jones, in contrast, thinks the transition will take closer to thirty years because of weak links – even if we automate most tasks, the ones that don’t get automated will slow everything down (this aligns with what we see happening with AI diffusion into organizations right now). Slow doesn’t mean painless, though. And for a long time, we may not know which scenario we’re in.
My view is that there will be human jobs around for much longer than the prevailing narratives might suggest. Virtually all of these jobpocalypse scenarios of recent years have been mooted theoretically but not in the messy world of life. We’ll create more roles and that last mile (what Chad calls “the weak link”) will command decent wages. That doesn’t mean we won’t see increasing returns to capital over labor. So, societies might decide to change how they tax and redistribute. The different experiences between the UK and Norway over North Sea oil suggest that endowments seem to work better than transfers.
See also: I was on ’s podcast this week. We covered the AI bubble question, the productivity paradox and why Chinese AI engineers are Claude-pilled. Watch or listen here.
Washington has issued an export control order that prevents Anthropic from offering its Fable and Mythos models to non-US citizens, including Anthropic’s own employees. Apparently, researchers at Amazon discovered a jailbreak and it seems like Amazon’s boss, Andy Jassy, passed concerns on to the Commerce Department. (Amazon recently invested $5 billion into Anthropic and indicated it would invest a further $20 billion, having already put $8 billion into the firm and acting as its major distributor.)
The reaction seems a little over the top, given the minor trigger. I’d half expect it to be diluted in the next few days. Or it might just be the next stage in the feud between the Defense apparatchiks and Anthropic.
But it comes at a time when Anthropic, OpenAI and DeepMind are signaling they’re in favor of slowing down frontier AI development. rightly asks, what did they see? Is it the fear of the growing backlash or a genuine capability explosion?
My brief thoughts on what’s behind this.
The most charitable reading is that the labs feel they are reaching a point at which their AI models challenge the security assumptions that underpin modern life. This isn’t unreasonable: they have consistently worried that this point might arise. That actual point may still be years away, but Demis and Dario do think in long arcs – and we might need years to prepare.
There is a less charitable reading that is also plausible.
2026-06-13 18:42:44
Thomas Piketty, a French economist, has a recipe for global justice.
In the Global Justice Report, Piketty and his co-authors recommend the world converge on a national income of €60,000 (around $68,000) per capita in 2025, in PPP terms, by 2100.
They, too, propose we:
Keep annual growth in Europe and the US to roughly 0-0.5% while poorer countries catch up,
Cut working hours to about 1,000 per worker per year,
Consume fewer material goods and more education, health, care and culture.
Fund the transition with steep taxes, including a wealth tax on billionaires and very high top income-tax rates.
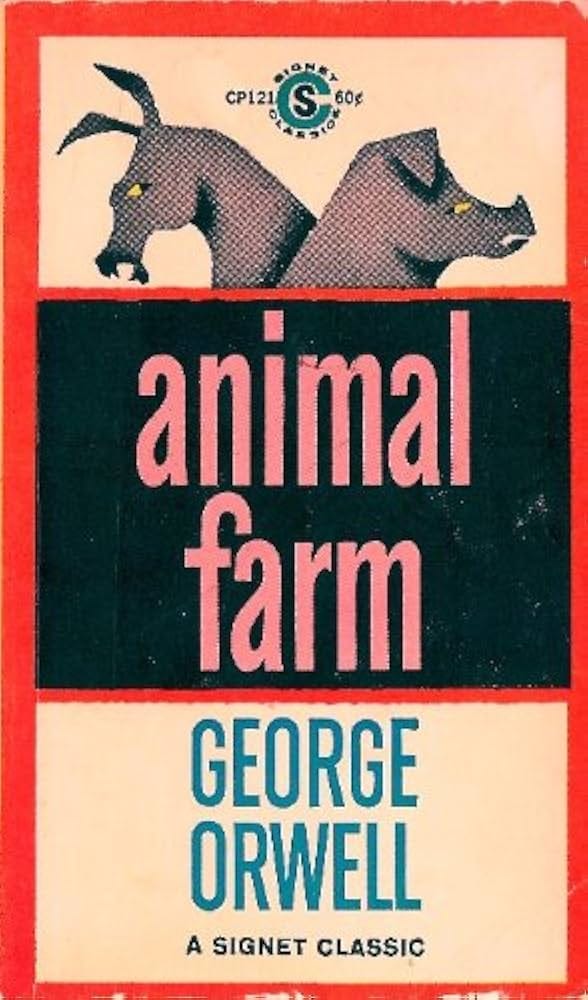
Reports like this arrive with a splash: they profess to be blueprints for a just global economy. But this isn’t that. It’s really a roadmap to Animal Farm.
The report misreads the history. It embraces growth for poor countries while freezing it in rich countries, as if the two were separate. The great escapes from poverty happened through trade, technology, supply chains and frontier knowledge. Much of it originated in wealthier nations. If the economic frontier slows down, the authors need to explain how the channels that allowed poor countries to converge would keep working as before. For a deep dive on growth and extreme poverty, read this.
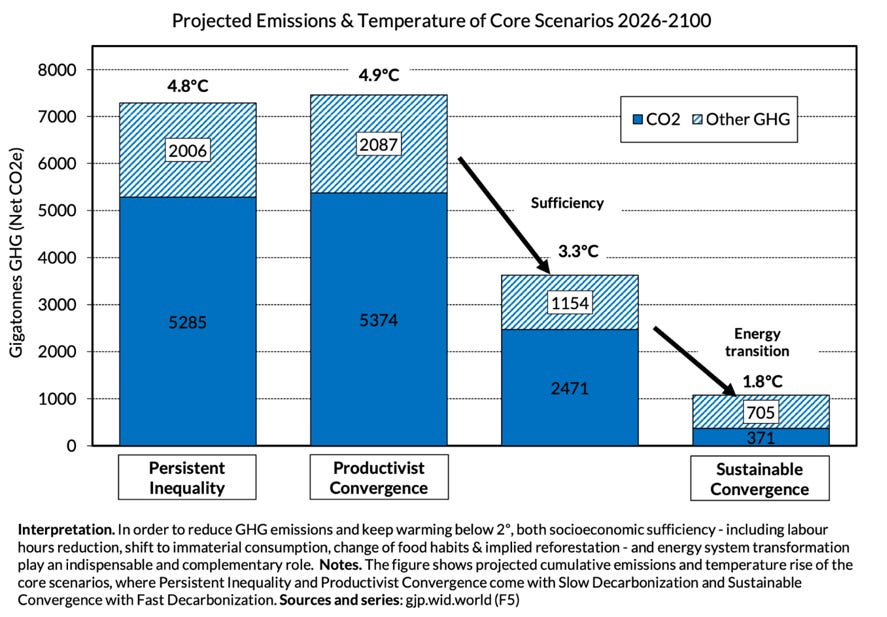
Bad science. For their climate assessment, the policy baseline is set at 4.8-4.9°C by 2100, which roughly aligns with the now discredited and “implausible” RCP 8.5 scenario. RCP 8.5 ignored that learning curves for solar and other renewables exist entirely. Robust academic research dating back to 2016 had already discredited it. (Read on this here.)
Piketty has argued he used his own climate modelling projections, which happen to align with RCP 8.5. It makes at least one titanic assumption that we fail to “accelerate the energy transition.” That latter assumption is absurd given this is already happening. Solar, batteries, electric vehicles and many other technologies are on steep learning curves and spreading like topsy.
Implausible politics. In the proposal, global incomes would converge at €5,000 per month (about $5,700) by 2100, with lower inequality within countries. For Western Europe and America, this would essentially mean a freeze on economic growth. In the case of the US, a growth in incomes of 0.12% per annum for 75 years. It is impossible to imagine 18 US electorates, from 2028 to 2096, agreeing to this. There would have to be some kind of external force majeure, an extraordinary top-down imposed policy against the will of citizens in nations across the globe. This is anti-democratic in its own right.
2026-06-07 11:21:28
American companies spending the most on AI have seen their revenue grow five times faster than the economy as a whole. Non-spenders are tracking the economy closely. This is according to Ramp, a fintech with a side hustle in excellent firm-level data across the US.
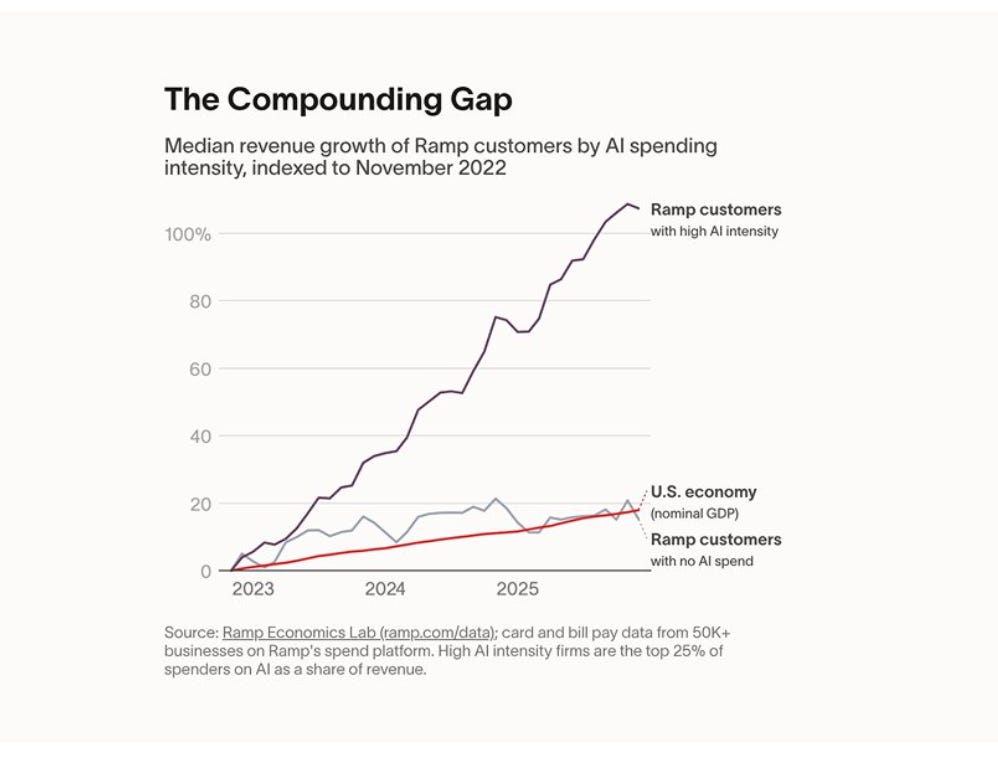
Ramp’s finding echoes this 2020 AEA paper by James Bessen and colleagues. Bessen examined broadly defined automation investment at the firm level across the Dutch non-financial economy between 2000 and 2016. Firms that automated grew sales 2% faster than those that didn’t.
But which firms automated? Other studies by Acemoglu et al. give some kind of answer: automotators were already largely more productive and had higher output than non-automators. In my book, I took this further, arguing that any type of automation is a complex undertaking and requires a better management team than not.
AI also seems to be fuelling a surge in new business formation, according to Torsten Slok. It’s much easier and cheaper to launch a company today with the help of LLM-based AI. A mediocre ChatGPT lawyer, finance director or marketing manager is, after all, better than none.

In the hysteria of the AI narrative, all of this is boringly plausible. It’s a technology which reduces the costs of certain classes of cognitive activities; so we’ll do more of them.
Anthropic released some fascinating data on how Claude has changed the way Claude itself is built. The amount of code contributed per developer is eight times higher in the current quarter than the average to the end of 2024. There is a meaningful uptick starting in 2025 as Claude 4 and Claude Code were rolled out. We discuss whether lines of code are a meaningful metric below.
I found this chart more interesting—showing how well Claude Code can complete different classes of tasks. It appears that the Mythos, Anthropic’s latest release, which is only available internally and to select organisations such as the NSA, has demonstrated a step change in capabilities.
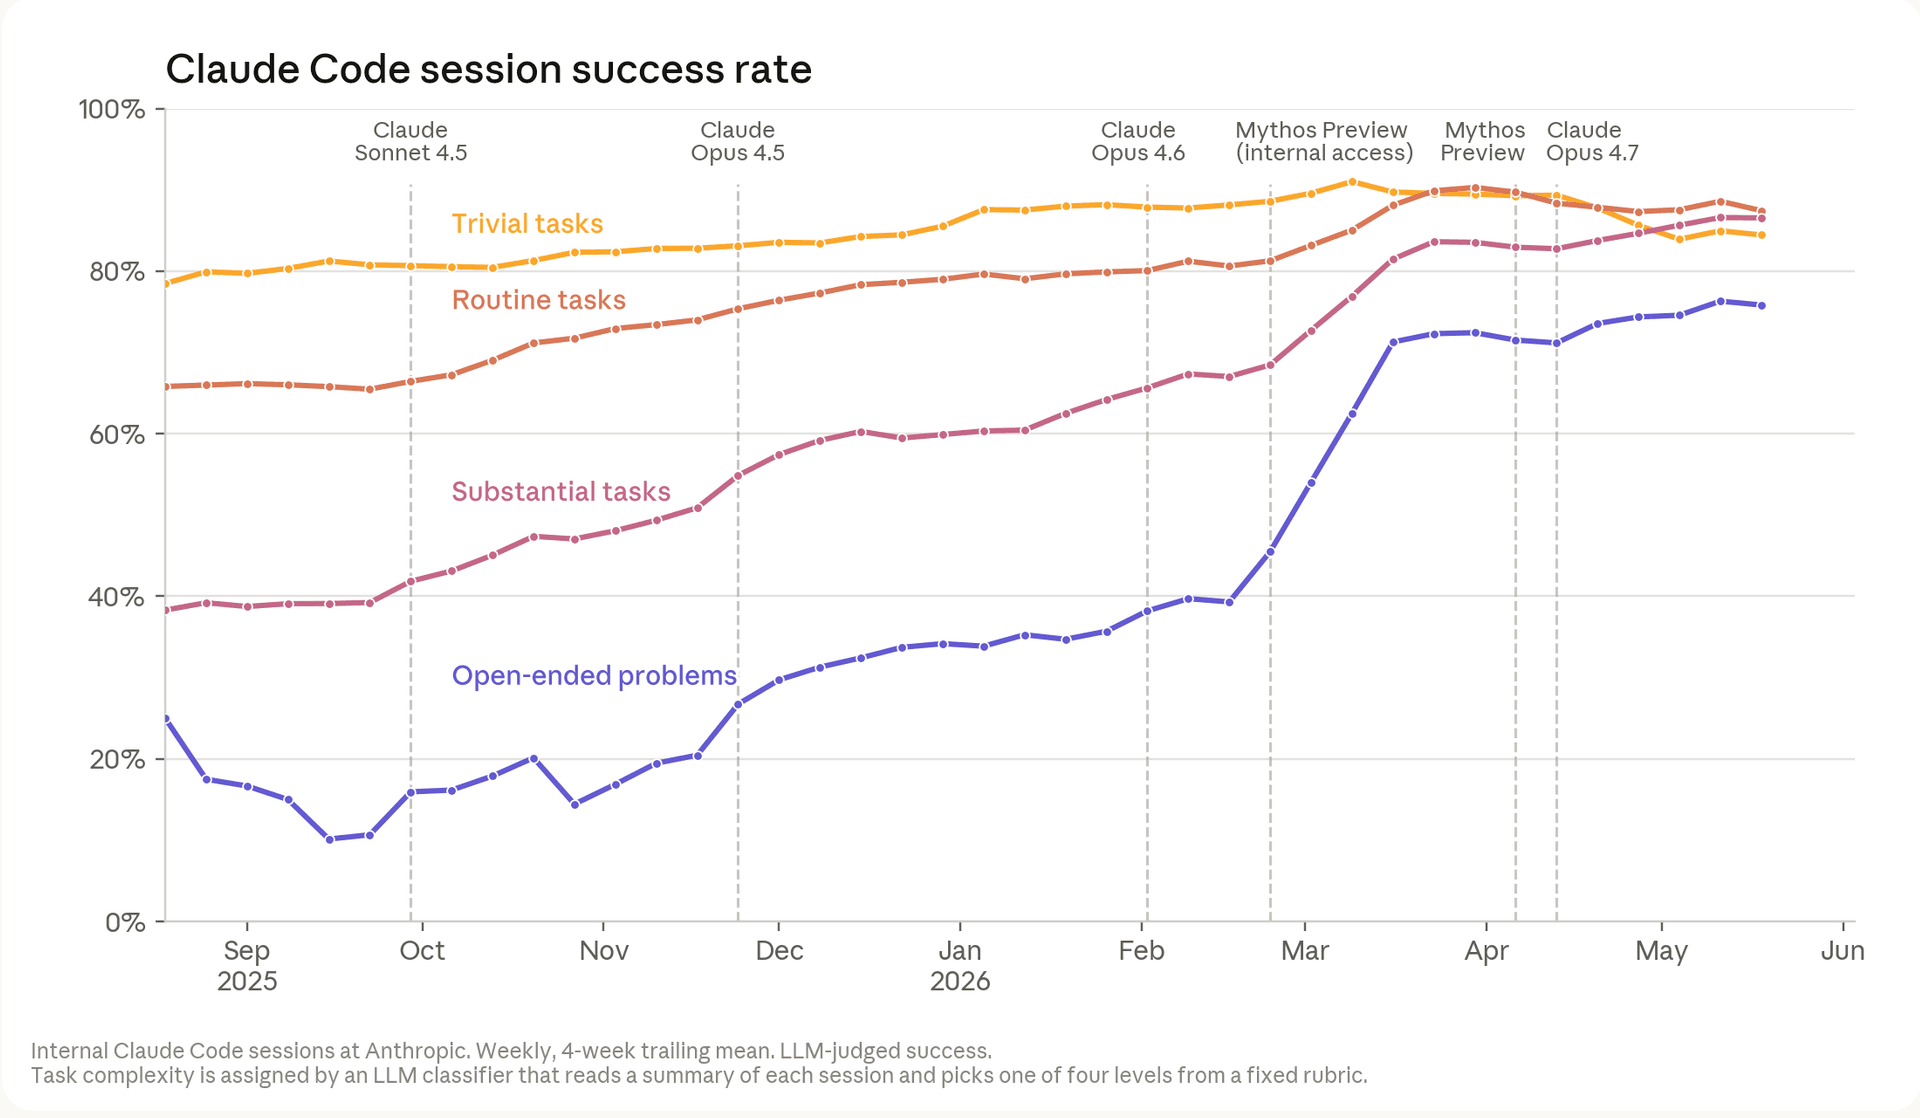
Anthropic took the opportunity to warn against the risk of recursive self-improvement, going as far as suggesting “it would be good for the world to have the option to slow or temporarily pause frontier AI development to enable societal structures and alignment research to keep up.” To be fair to Anthropic, they’ve been reasonably consistent with that idea for a few years—as have others.
A multi-lateral process can’t hurt things much, especially in today’s fractious environment. However, I’m sceptical about this threshold for “recursive self-improvement” as a notion of a runaway technology. For two reasons. First, we are dealing with increasingly abstract layers of automation that accelerate the product roadmaps of human-directed companies (not out-of-control machines). So there may be a risk, but it isn’t recursive. It’s a strategy. The second is that commercial realities act as a natural attenuator: securing the capital, the chips, and the power will prove less tractable than pouring out reams of Python code.
2026-06-04 01:07:06
Would you go to your gym if you had to pay for every visit? Probably not. We generally prefer those bundled memberships, even if we never hit the leg press after January.
AI companies have, until recently, been a lot like gym owners, offering generous bundles. And most AI users have been like gym-goers, occasional, sometimes frequent users. But others have been voracious and incessant, churning through their Claude and ChatGPT subscriptions.
And now, the AI labs have changed their tune, introducing more usage caps and metered pricing, particularly for coding tools.
So does moving from bundled pricing to metered pricing expand or shrink markets?
It depends.
Bundles expand markets when marginal costs are low and when customers get a diverse set of benefits from the bundle. A gym membership is a good example: it doesn’t matter whether the gym-goer visits twice a month or 10 times a month; it costs the same for the fitness company to serve. At the margin, if everyone went all the time, the model might break due to congestion and increased cleaning and maintenance costs.
However, if a product has variable costs, a pricing bundle is really a decision about who bears the risk of over- or under-use. If the bundle favours the buyer, the buyer has no incentive not to max it out. Few of us can spend more than 20 or 30 hours a week in a gym, but many of us can run riot with AI coding models. And AI models do run up substantial variable costs for those peddling them.
Chatbot usage is all over the map. Sarah Friar, OpenAI’s finance chief, noted that ChatGPT Pro users hit the app 11 times more frequently than active free users. That 11x is wide enough. But consider what happens with agents. If I am hunting-and-pecking in a chatbot, I’ll struggle to consume 100,000 tokens a day. R Mini Arnold, my agent, won’t get out of its SSD for less than 100,000,000 tokens a day. I spotted one user racking up 130 billion tokens in a month.
Moving from bundles to usage-based pricing brings with it sticker shock. But it is manageable. Consider Uber. The taxi company has put an AI cap on its 5,000 developers. Today, they are limited to $1,500 per month or $18,000 dollars per year per agentic coding tool. Like Oliver Twist, developers can ask for more. If all 5,000 developers spent the full $18,000 a year, the bill would be $90m. Against Uber’s 2025 free cash flow of $9.8bn, that is less than 1%. It’s essentially immaterial; a good CFO can deal with it in a heartbeat. And Uber is likely to be a heavier spender than most of Main Street. The pricing debate isn’t really about affordability.
It’s really about whether the customer can connect spend to value.
Fortunately, we have a good precedent that can help us think this through. In the early days of Internet advertising, going back to AT&T’s banner advert on Hotwired in 1994, advertising was sold on a cost-per-mille basis. The advertiser paid for a bundle of impressions. Perhaps users clicked, perhaps they didn’t.

Today, Internet advertising has moved to a metered model. Customers don’t buy a bundle of impressions; they buy a metered outcome.
The question is: what happened to ad pricing as we moved to the metered models? And what happened to the size and profitability of that market?
Of course, you know the answer, but it is worth seeing the pattern. When pay-per-view was introduced, it helped grow that market and is now vastly preferred.