2026-06-16 20:01:07
Welcome to the Premium edition of How They Make Money.
Over 300,000 subscribers turn to us for business and investment insights.
In case you missed it:
SpaceX just pulled off the largest IPO in history, raising about $75 billion at a valuation near $1.8 trillion. The stock has already surged more than 40% in its first two days, pushing its market cap past $2.5 trillion, nearly as much as Amazon.
But it was only the opening act.
Anthropic and OpenAI have already filed confidentially to go public, setting the stage for massive IPOs in the coming months. Both could list above $1 trillion.
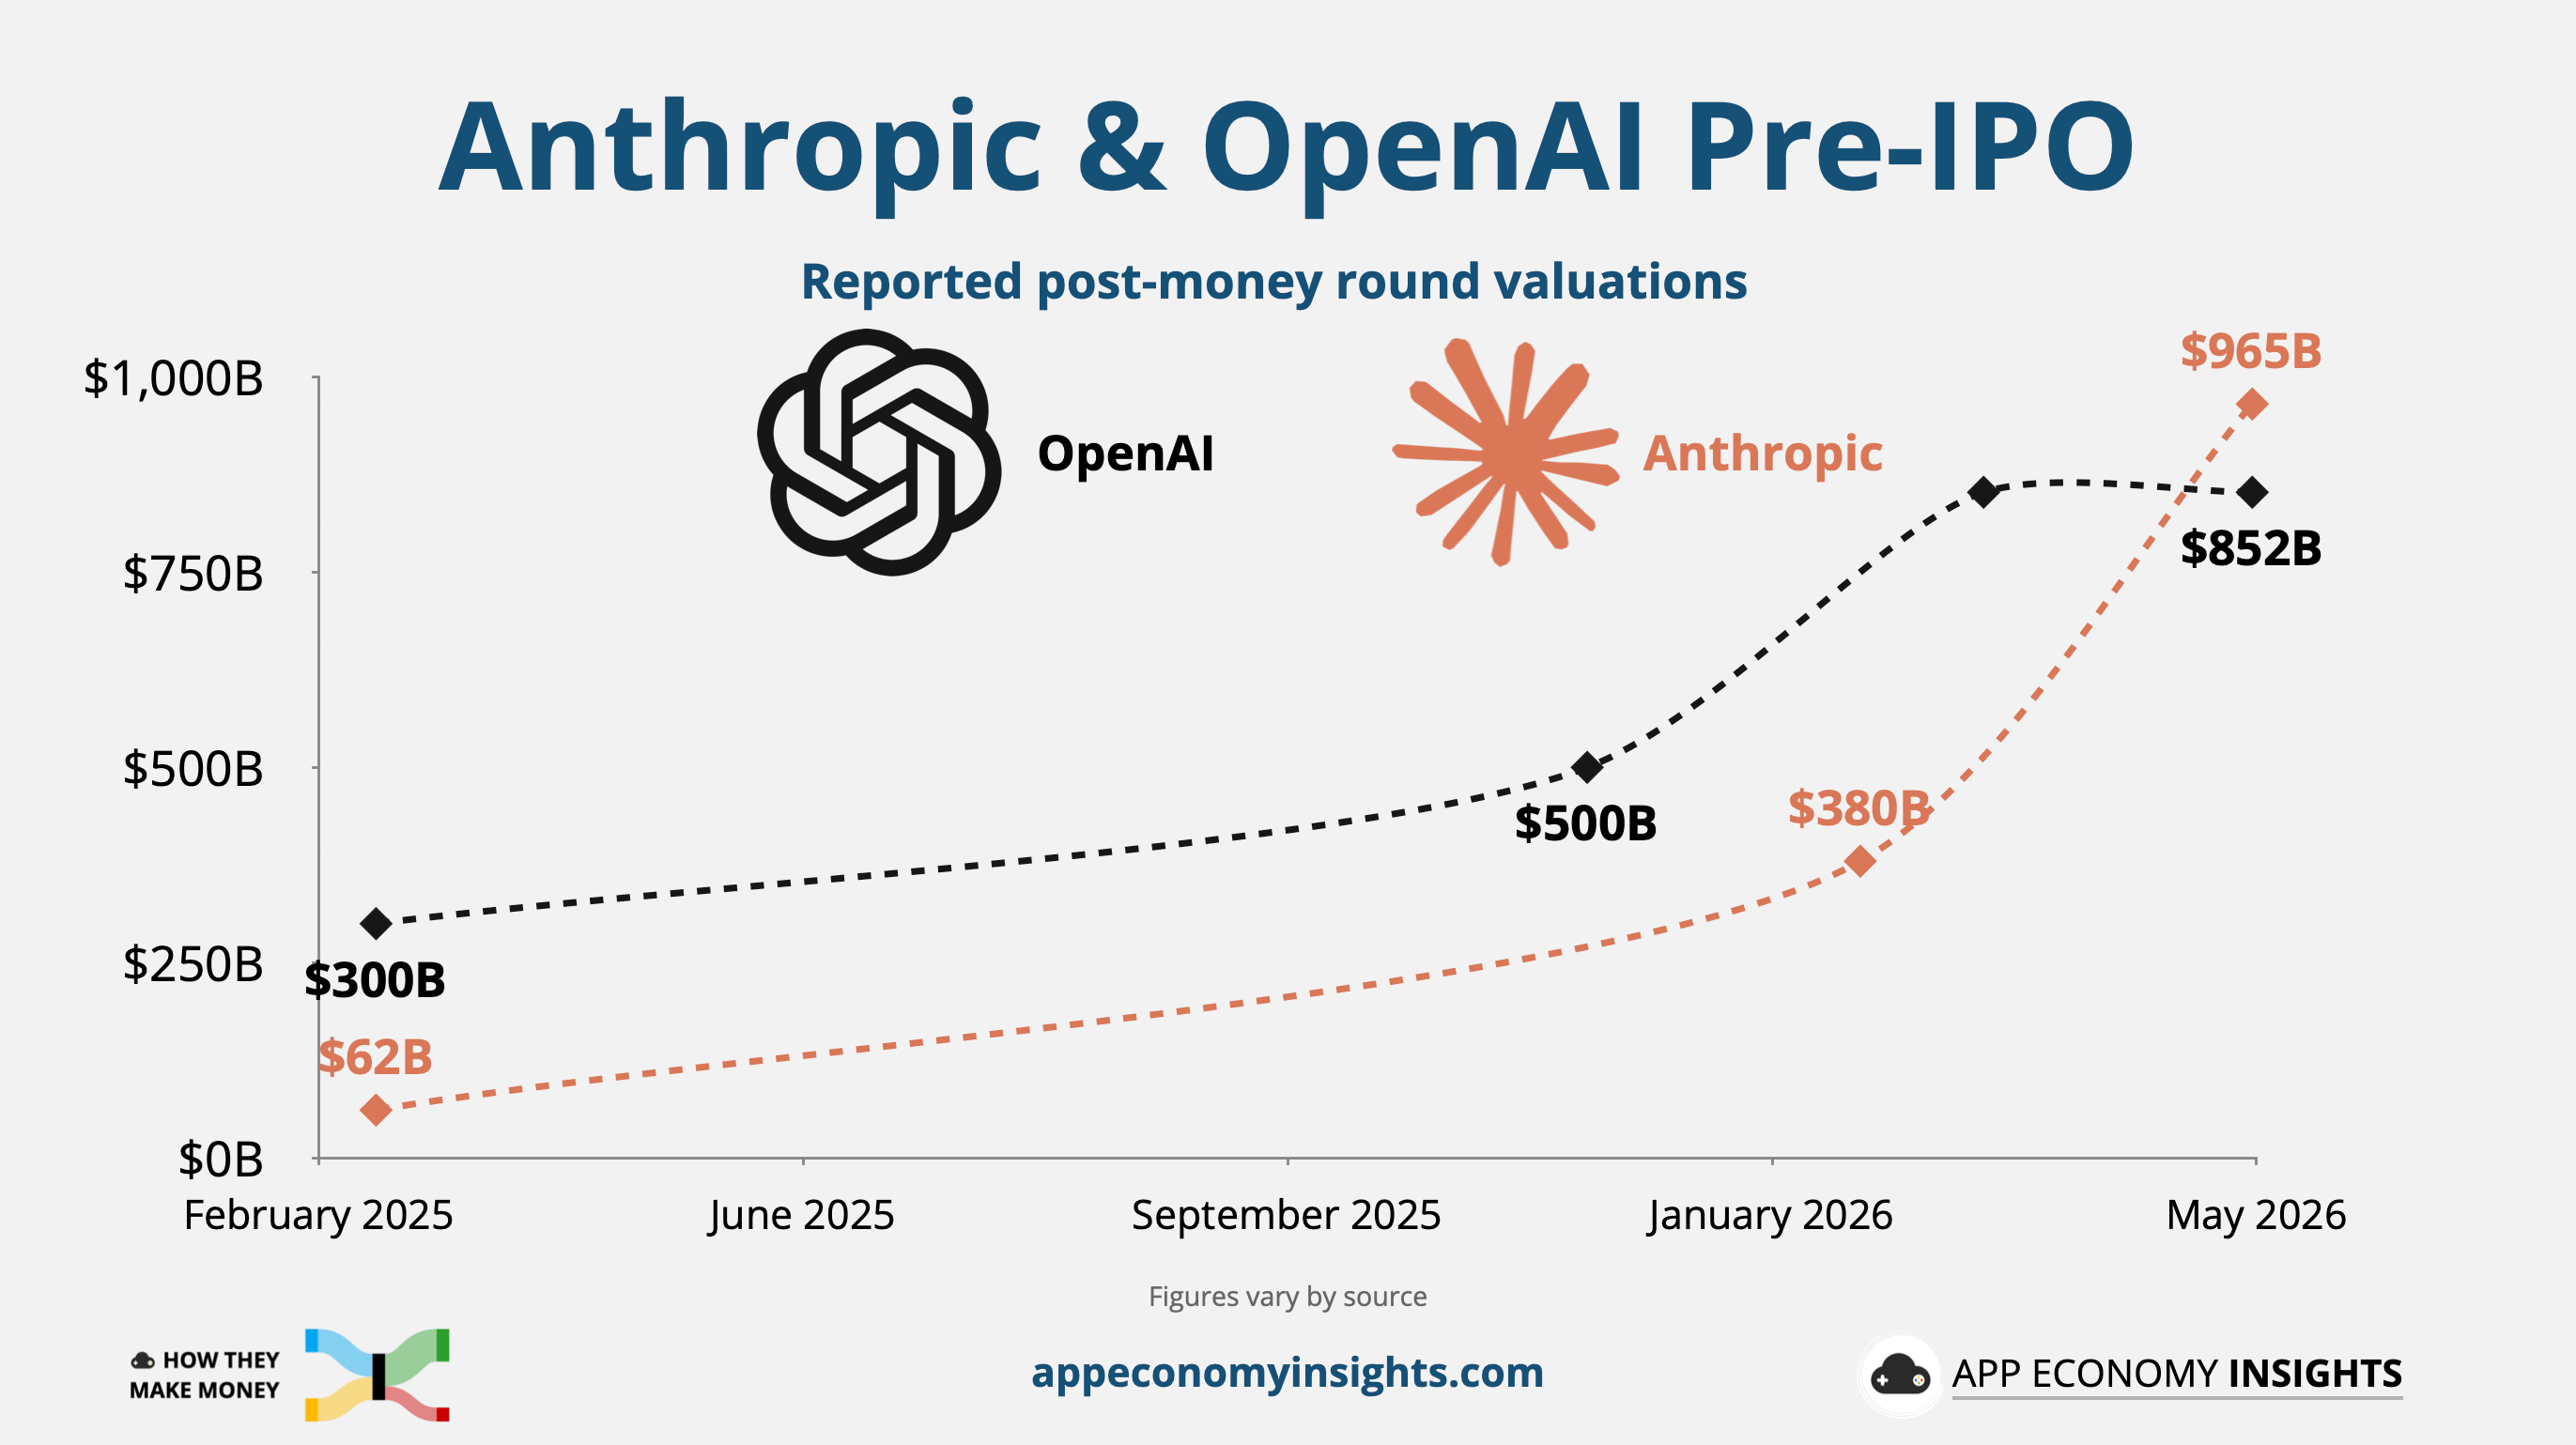
Anthropic’s private valuation has rocketed past OpenAI’s to $965 billion, making the Claude maker, on paper, the most valuable standalone AI lab on earth.
But the company just got a reminder of how fragile that value can be. On Friday, Anthropic received a US export-control directive restricting access to its two most powerful models. Because it could not screen users in real time, the company disabled both models worldwide.
Every major AI company is choosing where to sit on the build-vs-rent spectrum:
Build a frontier model like Anthropic, OpenAI, and Google.
Rent one from a company that already has.
Until last week, that looked mostly like a trade-off between cost and control. Now there’s another variable: the risk of regulatory shutdown.
Today at a glance:
The frontier’s very bad week
Why building just got riskier
Apple’s accidental hedge

2026-06-13 22:02:26
Welcome to the Saturday PRO edition of How They Make Money.
Over 300,000 subscribers turn to us for business and investment insights.
In case you missed it:
📊 Monthly reports: 200+ companies visualized.
📩 Tuesday articles: Exclusive deep dives and insights.
📚 Access to our archive: Hundreds of business breakdowns.
📩 Saturday PRO reports: Timely insights on the latest earnings.
Today at a glance:
☁️ Oracle: Backlog vs. Balance Sheet
🎨 Adobe: Freemium Bet
✍️ DocuSign: IAM Crosses 13% of ARR
🎿 Vail Resorts: Worst Season On Record
🐶 Chewy: Stretched But Steady
Oracle beat on revenue, beat on earnings, and grew its backlog by $85 billion during the quarter to $638 billion. The stock fell 12% anyway, its worst day since December.
The quarter wasn’t the problem. The incoming bill was. New CFO Hilary Maxson guided FY27 gross margins to “step down” and laid out ~$70 billion in net cash outlay, partly funded by a fresh ~$40 billion raise. Investors naturally scrutinize the cost of converting that backlog.
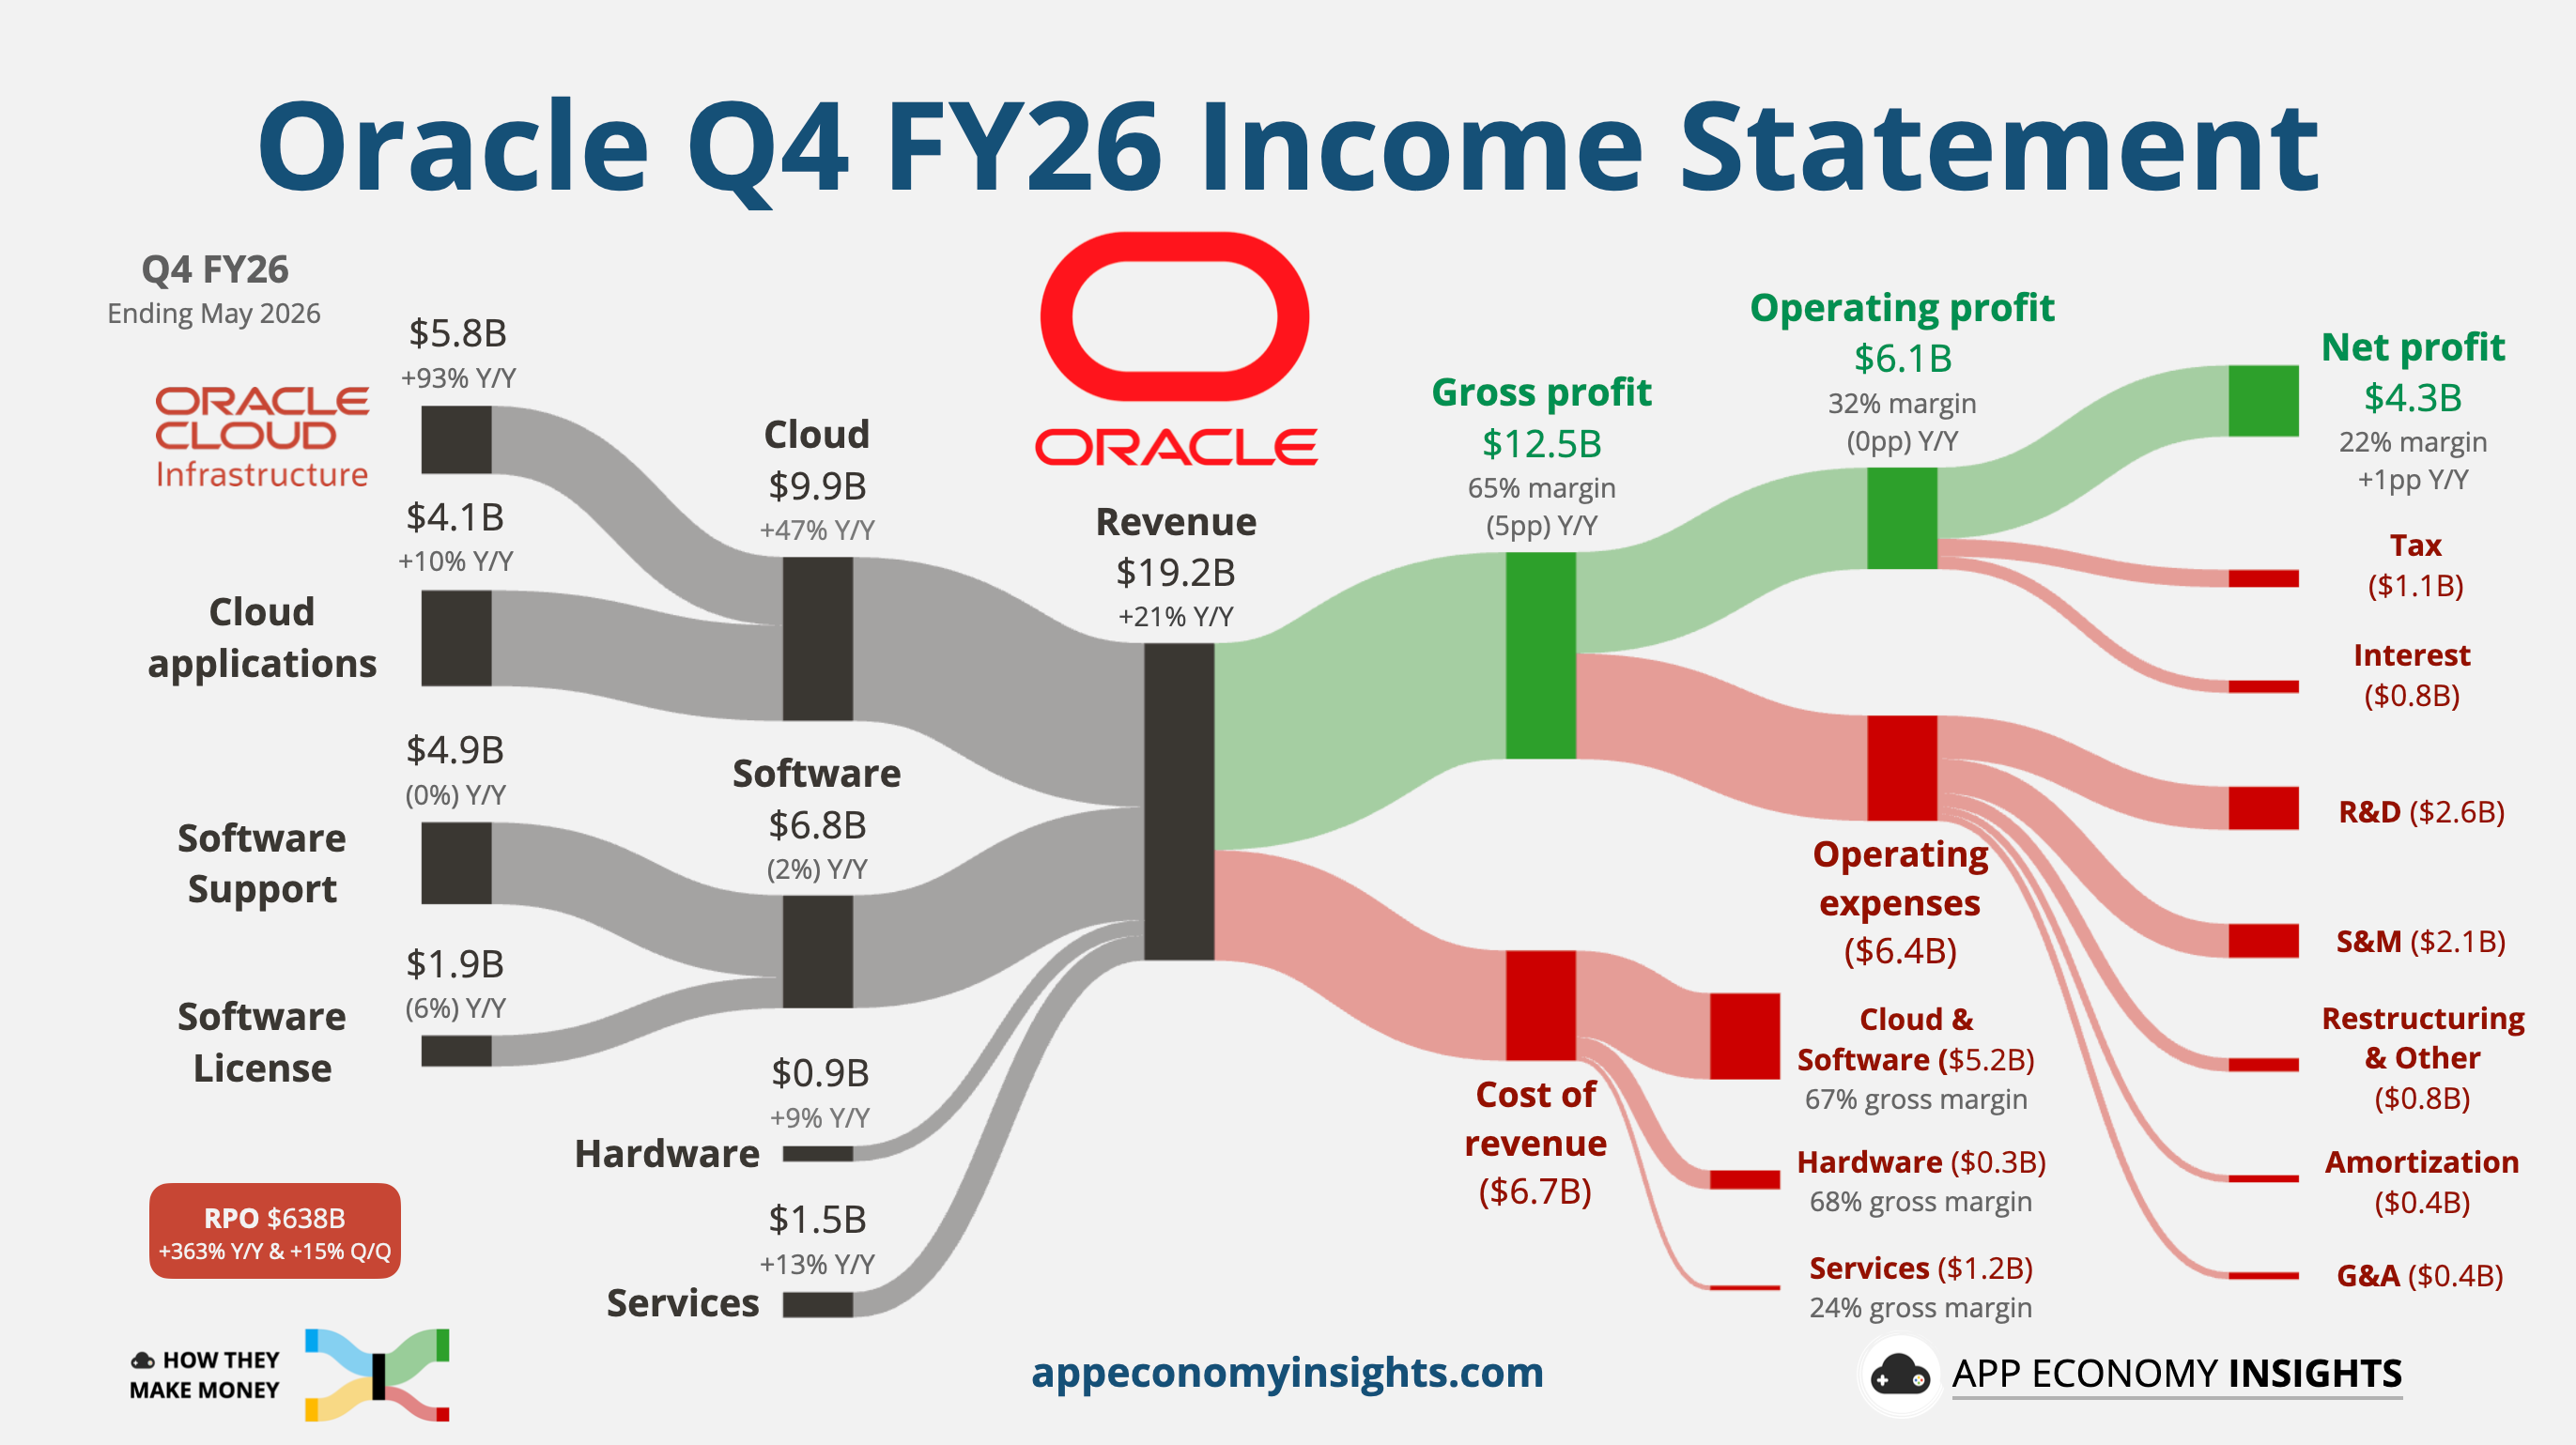
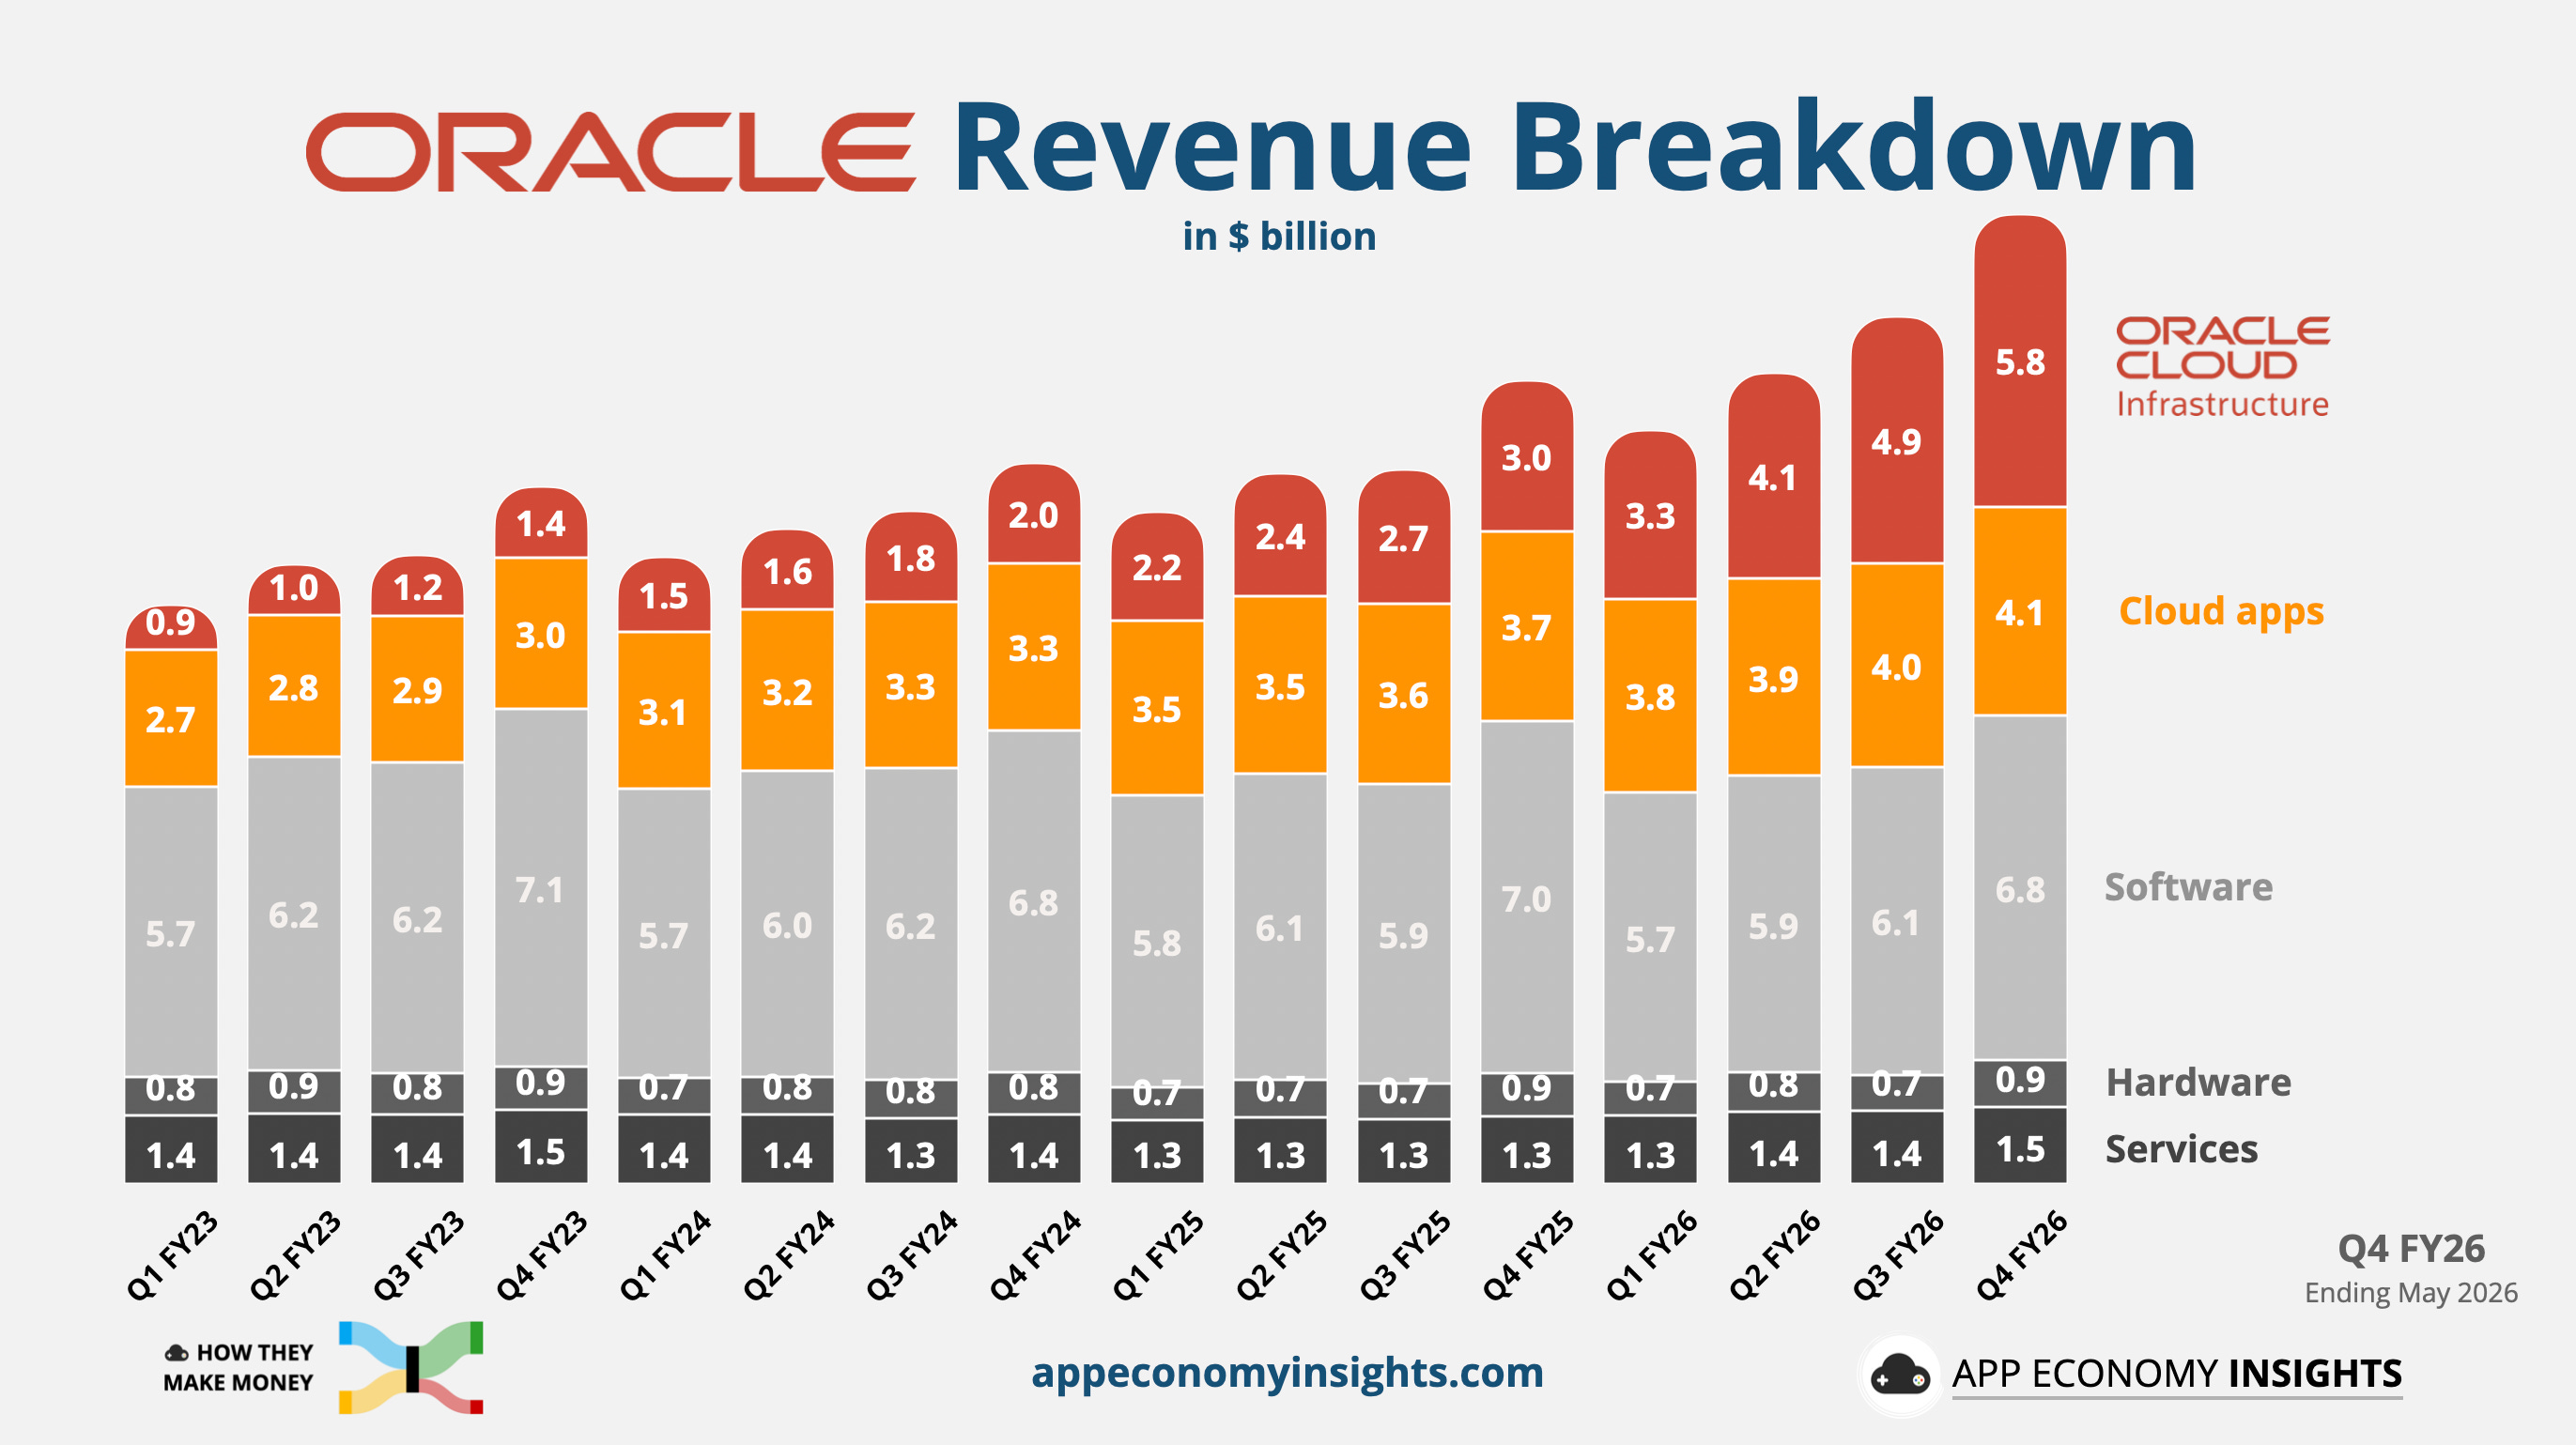
Revenue grew 21% Y/Y to $19.2 billion ($0.1 billion beat). Oracle Cloud Infrastructure (OCI) remains the main driver:
☁️ Cloud +47% Y/Y to $9.9 billion (OCI +93% to $5.8 billion).
🌐 Software -2% Y/Y to $6.8 billion.
🖥️ Hardware +9% Y/Y to $0.9 billion.
💼 Services +13% Y/Y to $1.5 billion.
Margin trends: The operating margin remained flat at 32%, while gross margin compressed by 5pp to 65% as lower-margin IaaS scaled.
Cash flow: For the full year FY26, operating cash flow was $32 billion (+54% Y/Y), but that’s not enough to fund the CapEx ramp. Free cash flow stayed deeply negative (-$24 billion) as CapEx hit $56 billion, above the $50 billion plan.
Balance sheet: Oracle raised $43 billion in debt and $5 billion in equity in FY26 and expects another ~$40 billion in debt and equity financing in FY27. Oracle now has a net debt of $124 billion, including operating lease liabilities.

FY27 guidance: Management reaffirmed FY27 revenue guidance of ~$90 billion, implying ~34% growth. Capital spending is expected to reach roughly $70 billion of Oracle’s own cash outlay. Oracle expects to raise about $40 billion through debt and equity, with any new debt likely pushed to calendar 2027.
📈 The beat the market ignored: RPO jumped 363% Y/Y and 15% Q/Q to $638 billion, well above the ~$590 billion analysts expected. But the market has stopped paying for backlog alone and started pricing the cost of delivering it.
⚖️ Less funding pressure, still massive funding needs: Roughly $75 billion of Oracle’s large AI contracts is prepaid or customer-supplied hardware. That helps. But FY27 capital outlays are still enormous, and Oracle still needs external financing. The funding story improved at the margin. The absolute numbers got bigger.
📉 Margins are the new fault line: Oracle is building capacity before it fully bills. That creates a timing gap: CapEx now, revenue later. Management says infrastructure margins recover quickly once utilization ramps, but investors want proof.
🧱 The old Oracle is now shrinking: Software revenue fell 2% Y/Y. Oracle still needs that legacy cash engine to help fund the AI infrastructure buildout, and a contracting base makes the math harder.
Takeaway: Oracle delivered 1.2 gigawatts of incremental data center capacity in FY26 and expects Q1 FY27 delivery to approach 1 gigawatt. The bull case is becoming more concrete, but so are the capital intensity, margin pressure, and financing needs. Oracle is now a bet on execution.
2026-06-12 20:03:53
Welcome to the Free edition of How They Make Money.
Over 300,000 subscribers turn to us for business and investment insights
In case you missed it:
Hosted by Canada, Mexico, and the US, the competition kicked off Thursday. It’s the first one expanded to 48 teams. FIFA president Gianni Infantino calls it "104 Super Bowls in a month" (it's actually 39 days, but who's counting).
This year's teams will share a record $871 million in prize money, while some fans pay as much as $33,000 for a single seat.
Across this World Cup cycle, FIFA expects to take in roughly $13 billion. As a non-profit, most of that money is supposed to flow back into football: staging tournaments, funding member federations, and running the global game.
Today at a glance:
💰 The Four-Year Heartbeat
🌍 Where The Money Goes
🎟️ Pricing the People's Game
Because FIFA’s business revolves around the World Cup, held once every four years, the organization uses a four-year budget cycle.
The visual below shows the latest budget for the 2023-2026 cycle.
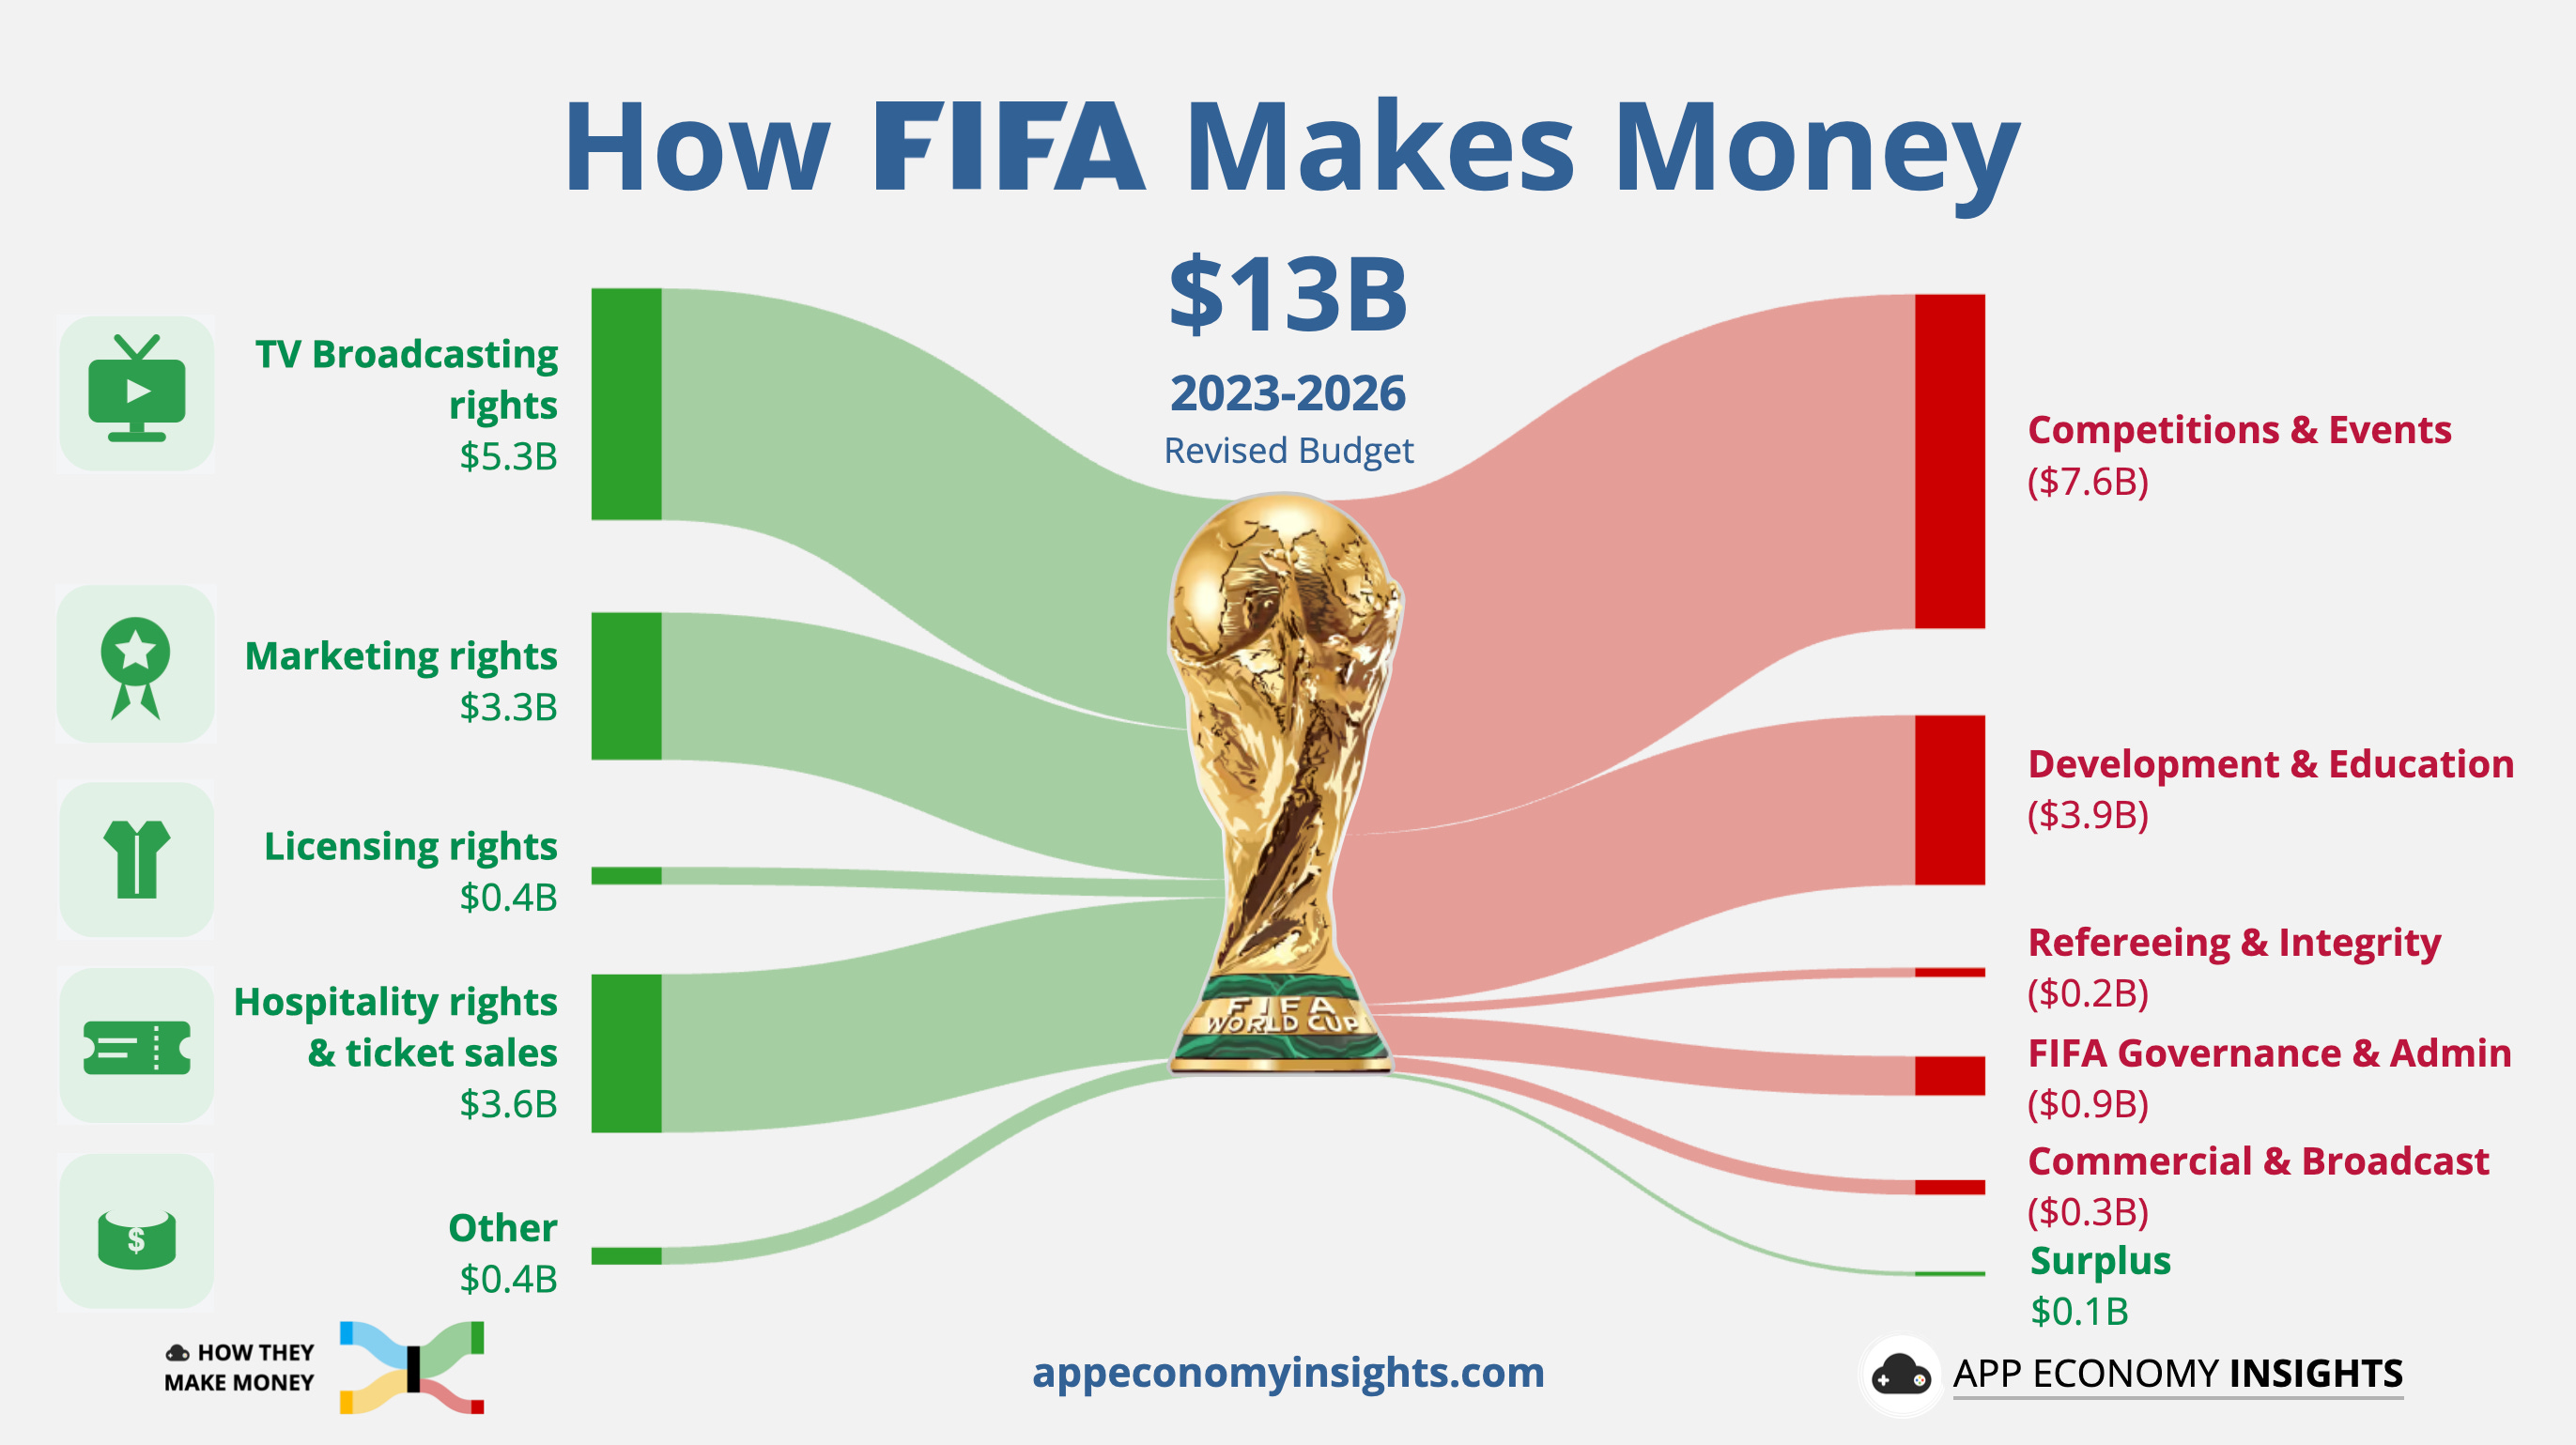
FIFA expects to earn $13 billion in this cycle, up 72% from $7.6 billion for the 2019-2022 Qatar cycle. That’s a big upside from the $11 billion it had previously budgeted.
The jump came from three places:
The field expanded to 48 teams (more inventory to sell).
The tournament landed in the US (the richest media market on earth).
FIFA bolted on a second large event in the US, the revamped Club World Cup.
Here’s where the revenue comes from:
📺 TV Broadcasting ($5.3 billion, ~40%): FIFA’s largest stream by far. It sells the right to air the matches to networks region by region, and the bidding runs hot because few events deliver a global audience watching live, all at the same time.
🎟️ Hospitality & Ticketing ($3.6 billion, ~28%): Match tickets plus premium corporate packages, run through a FIFA-owned subsidiary so every dollar flows straight back to headquarters. 2026 is the first World Cup with dynamic, demand-based pricing, which sent the top end soaring (more on this in a minute).
🤝 Marketing & Sponsorship ($3.3 billion, ~25%): The deals brands like Coca-Cola, Visa, and Adidas pay to attach their name to the tournament, sold in tiers from global partners down to regional supporters. Sponsors spend several times more on advertising, though that money goes to agencies and broadcasters, not FIFA.
🏷️ Licensing ($0.4 billion, ~3%): FIFA-branded merchandise, video games, and royalties on the FIFA name. Tiny next to the rest, and almost a rounding error.
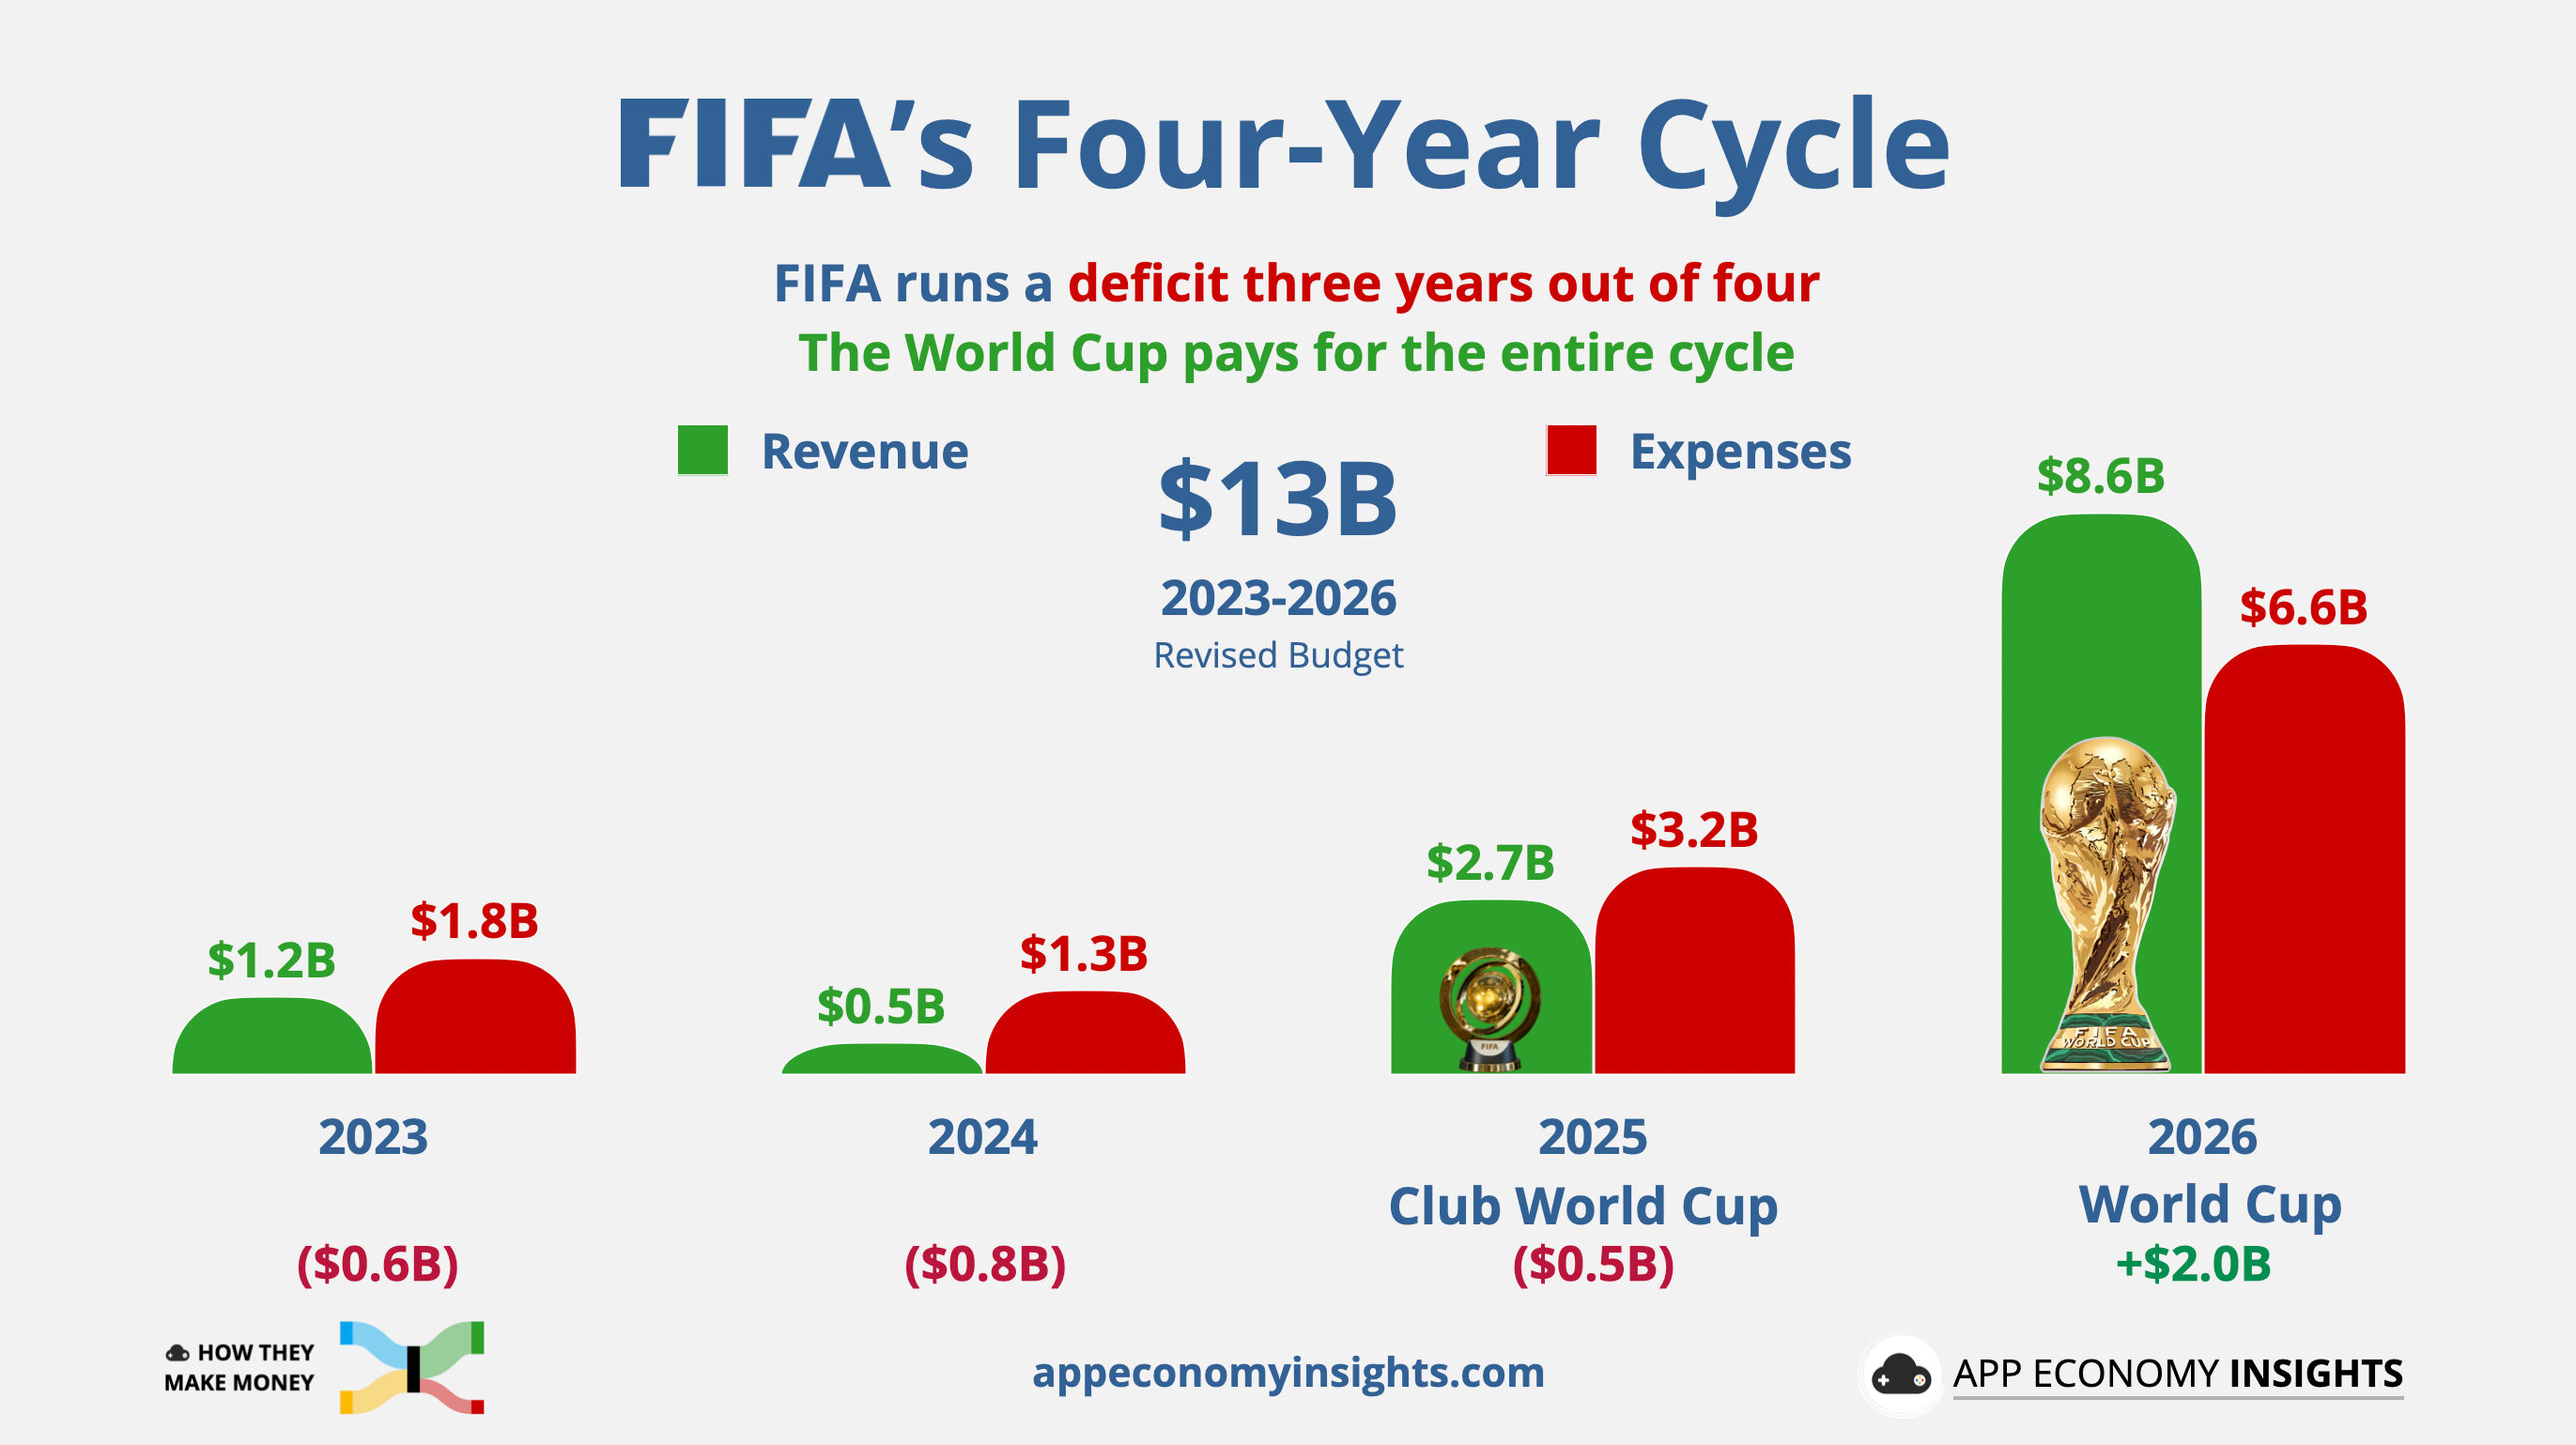
FIFA runs a deficit three years running, then the World Cup arrives and pays for everything — nearly $9 billion in a single year. The Club World Cup debut in 2025 also created a revenue boost. The lumpiness is the design, with a budget built with that timeframe in mind.
Takeaway: For a non-profit, near-breakeven is the whole point. The cycle is engineered to look like FIFA reinvests almost everything. Which raises the real question: where does the money actually go?
Almost none of that $13 billion stays with FIFA, and that is the entire point.
The 2026 World Cup is unusually asset-light for FIFA. Every match will be played in an existing stadium, many of them NFL venues. Unlike Qatar’s reported $200 billion buildout, the tournament does not require a countrywide stadium construction boom. More of the revenue can flow back into football.
Here’s where it goes:
🏟️ Competitions & Events ($7.6 billion, ~58%): The largest line by far. This is the cost of staging the tournaments themselves: running the World Cup and FIFA’s other events, including the prize money paid to teams.
🌱 Development & Education ($3.9 billion, ~30%): The money FIFA puts back into the game. Through its FIFA Forward programme ($2.25 billion of it), FIFA funds all 211 member federations: pitches, youth programs, and grants in places the commercial market overlooks.
🏛️ Governance & Admin ($0.9 billion, ~7%): FIFA’s own running costs. Salaries, governance bodies, and the day-to-day expenses of operating the organization itself. That includes the compensation package of roughly $6 million annually for FIFA President Gianni Infantino.
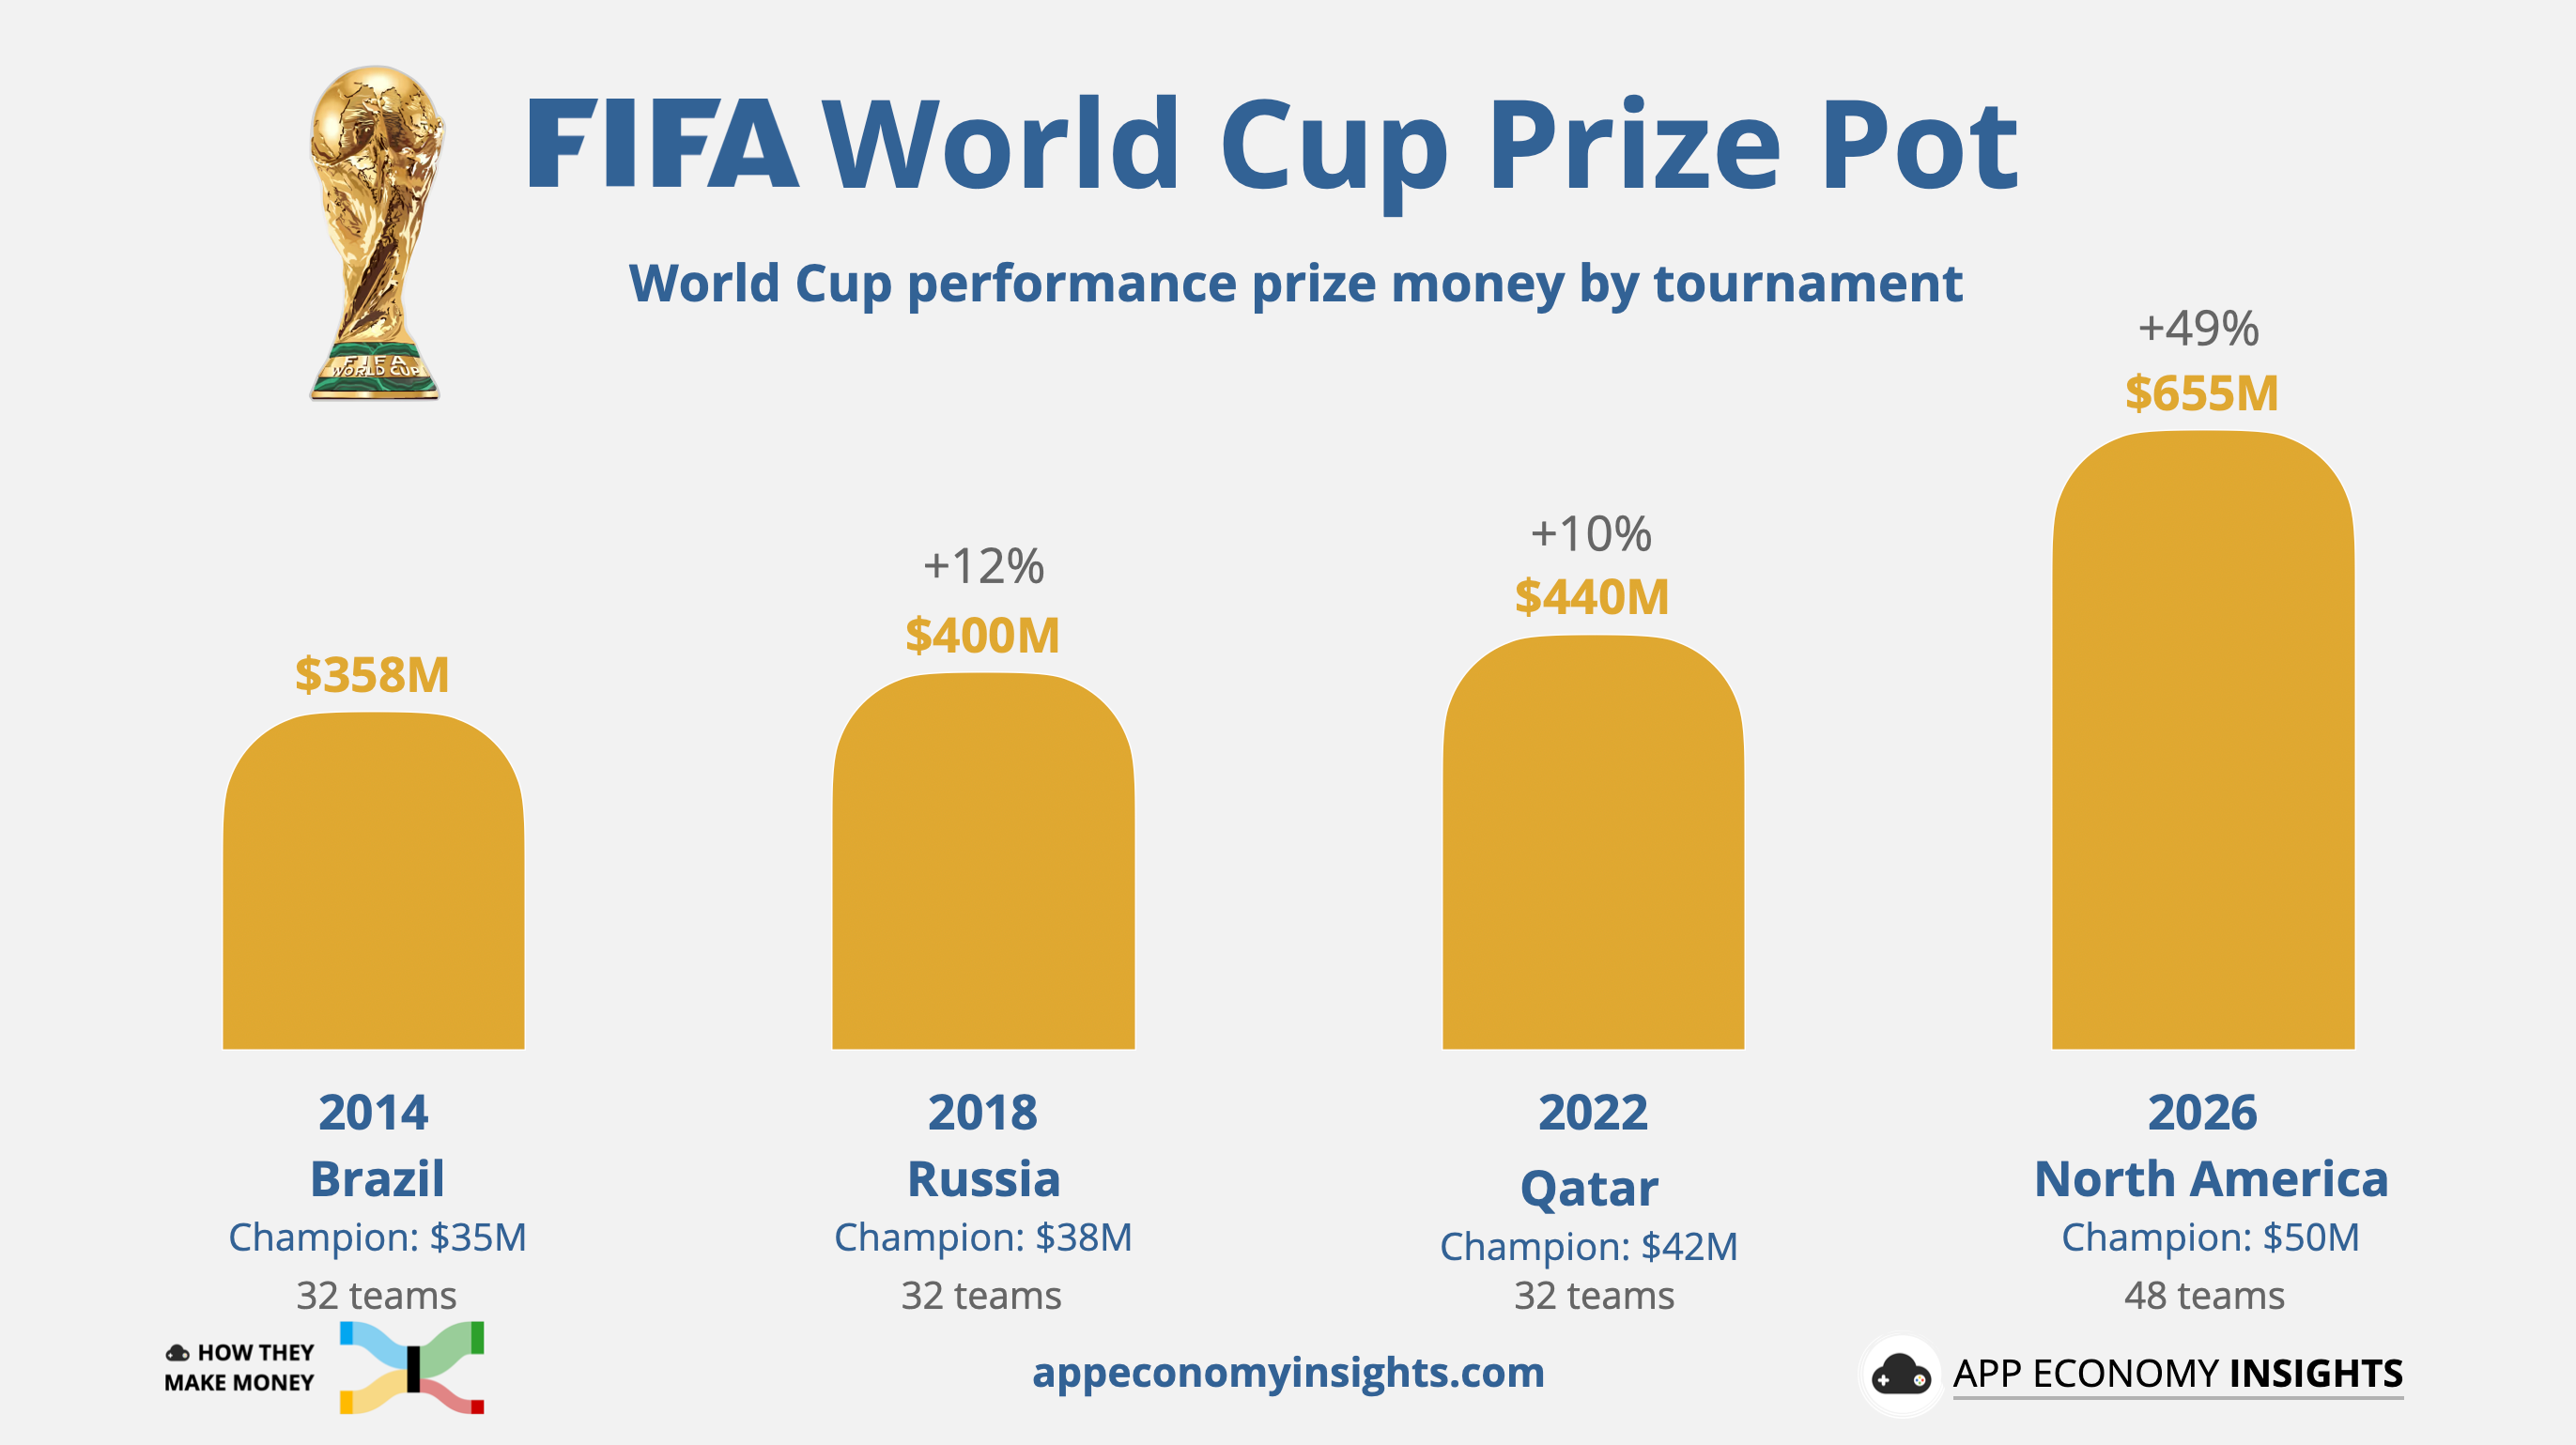
The World Cup Prize money pool is $871 million for 2026, including $655 million allocated to performance, a 49% increase over Qatar, with the champion taking home $50 million and even the first team eliminated leaving with over $10 million. The expansion of the competition from 32 to 48 teams was the main reason behind the increase.
Every member federation that receives a check also has a vote for the FIFA president. Infantino won in 2016 partly by promising to more than double those grants. He runs for a fourth term in 2027. Critics see a patronage machine. FIFA calls it growing the game.
In 2015, US prosecutors charged dozens of officials and sports-marketing executives over more than $200 million in bribes, almost all of it paid for the media and marketing rights to FIFA's tournaments. That history matters because media and marketing rights are still FIFA’s two largest revenue engines. The same machine that funds football also asks the world to take its redistribution on trust.
The books are built to break even on paper. But when revenue routinely beats budget, the surplus compounds into a reserve now approaching $2.7 billion.
Takeaway: FIFA runs a redistribution machine mixing sports and politics. The same dollars that grow the game secure the votes that keep the machine and its president in place. No rival governing body has built a flywheel this durable.
For the first time, the tournament uses dynamic pricing, ticket prices that float with demand, like airline fares. The contrast with the last US-hosted World Cup is brutal.
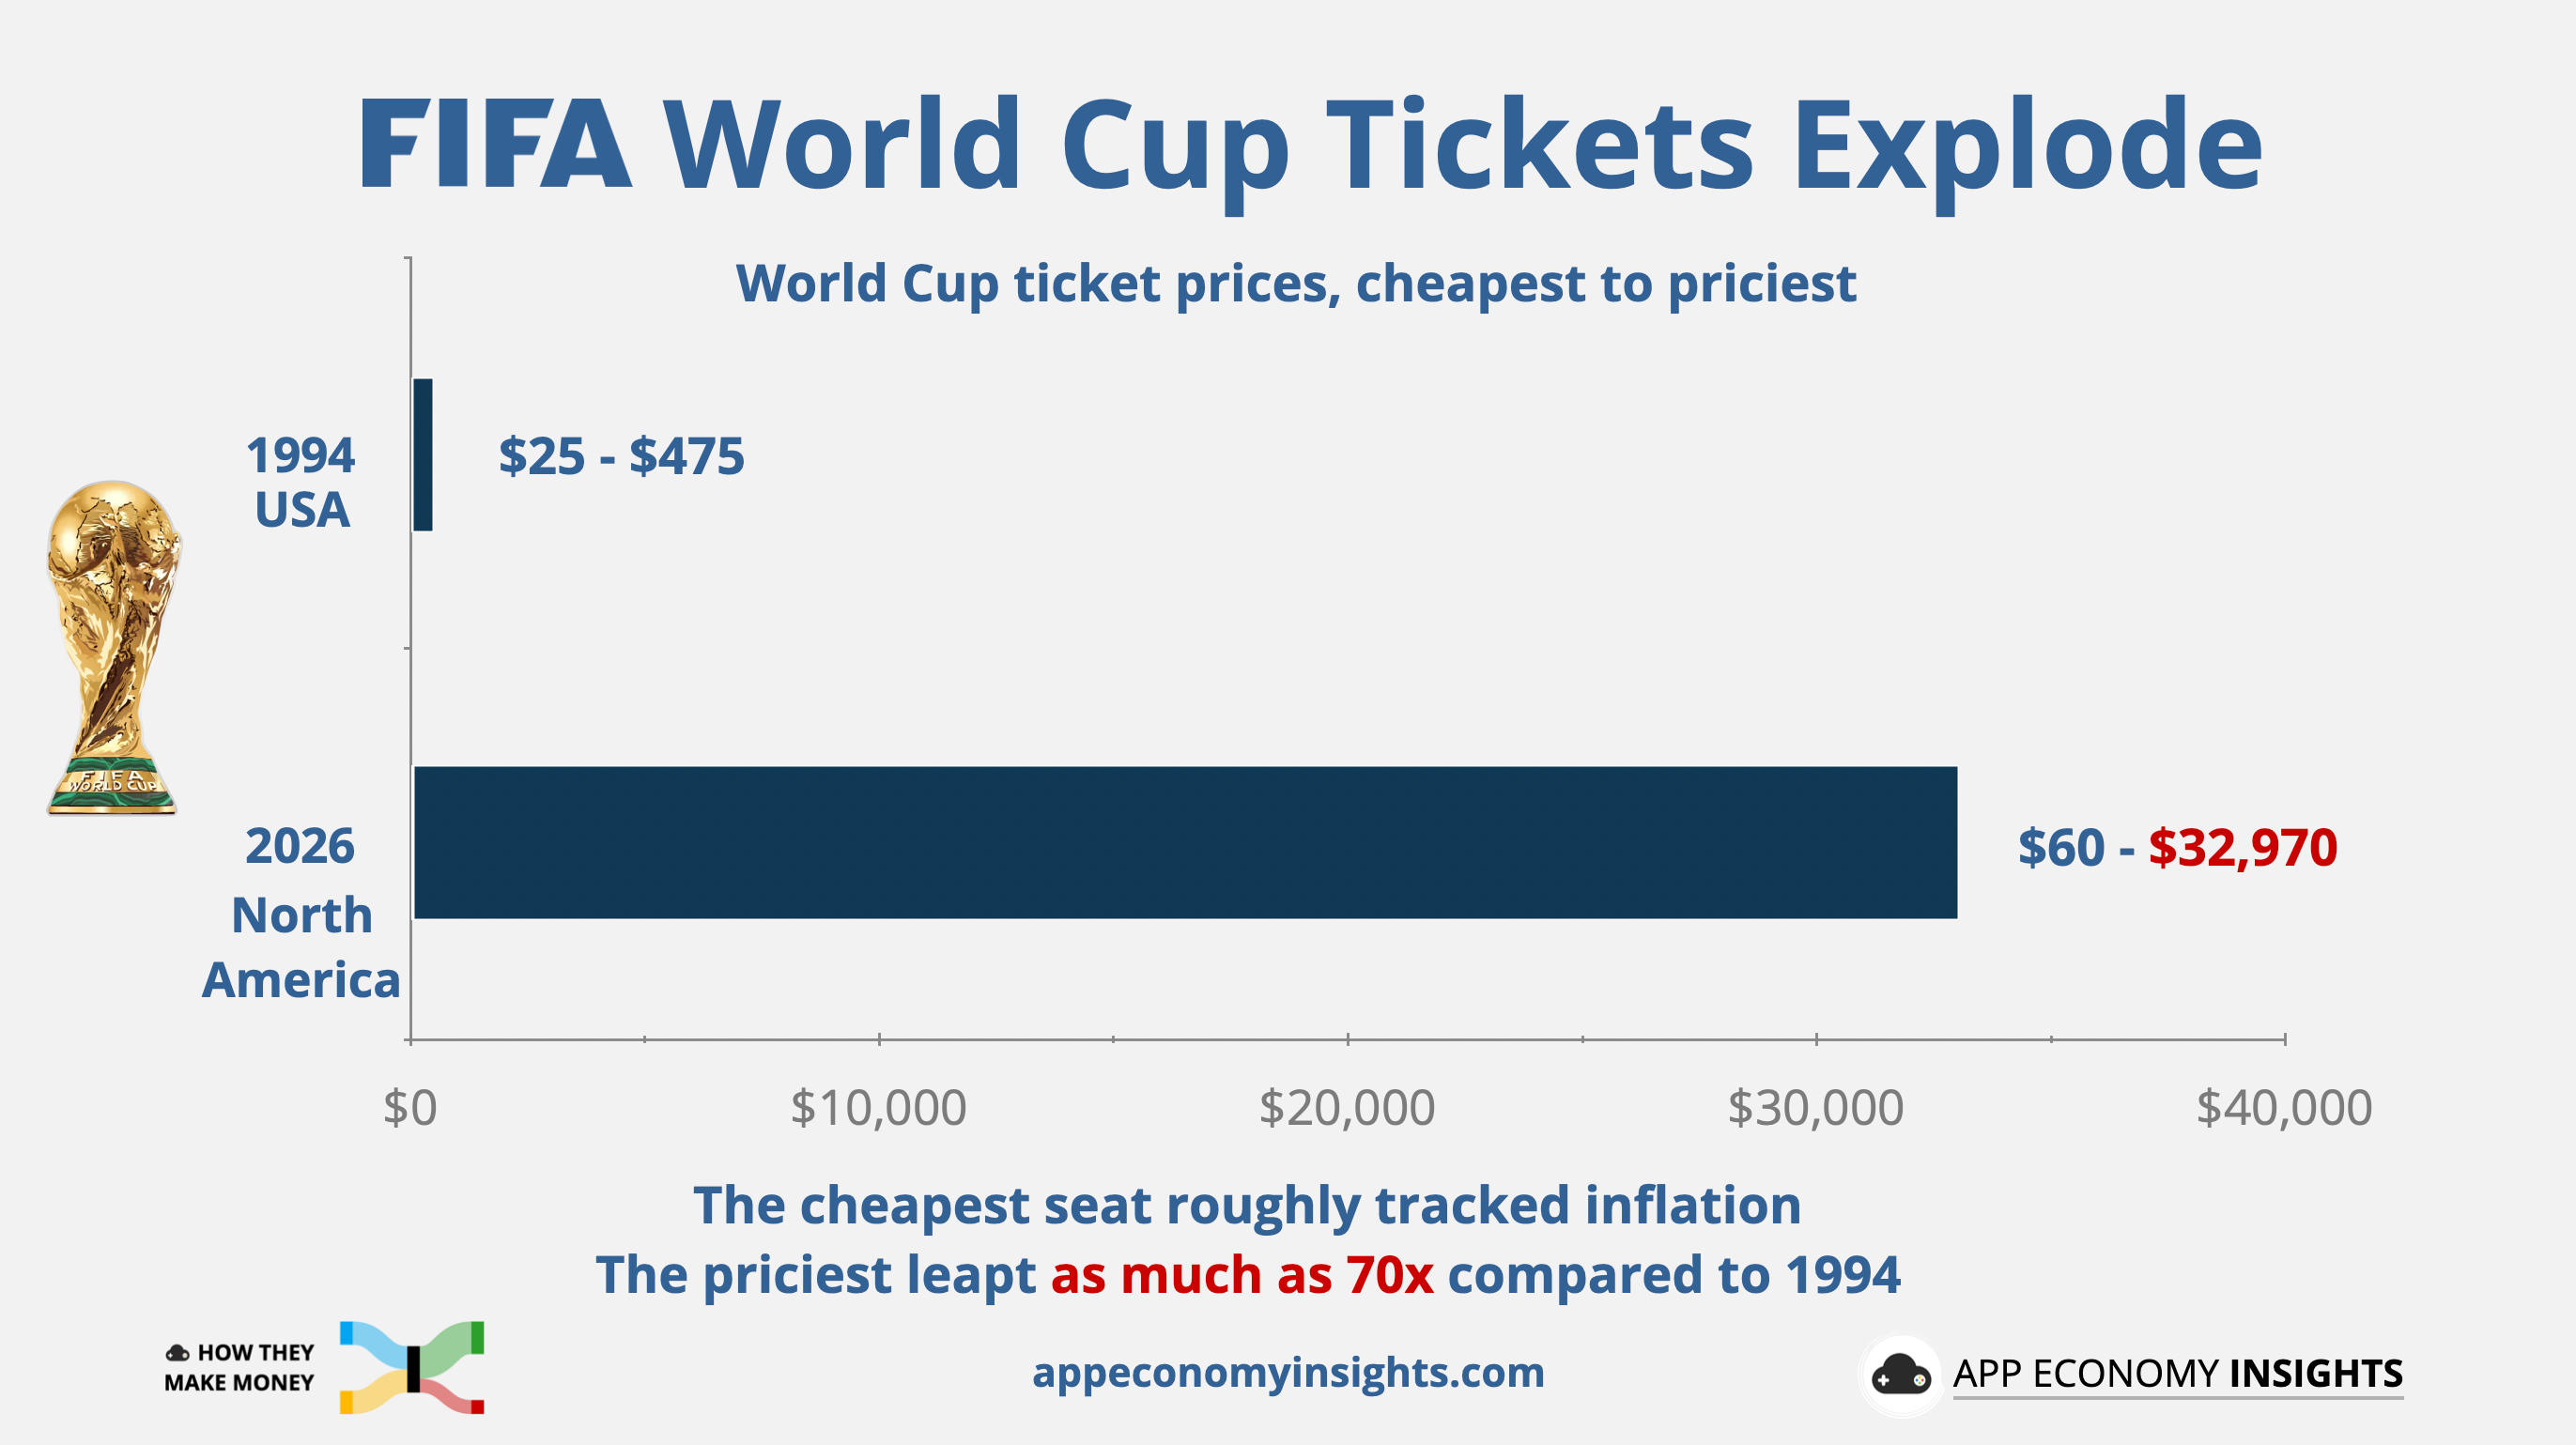
In 1994, a World Cup ticket ran $25 to $475. In 2026, the floor is $60, roughly in line with inflation. But the ceiling has detonated: $6,730 for the final at list, with premium seats that opened there climbing past $32,000 by May.
The cheap seats held. The expensive ones went up as much as 70×.
Some estimates put the average 2026 World Cup ticket around $1,300. That implies an increase of about 1,000% after inflation compred to 1994. Real median household income over the same span rose just 32%.
Football is the most popular sport on earth, played and followed by people of every income level. The World Cup carries public and national meaning, and pushing prices out of reach can erode its cultural value. The asset that makes the rights so valuable is football’s universality — and pricing out ordinary fans threatens exactly that.
FIFA pushes this hard for a reason. This is likely the last men’s World Cup on US soil for decades. FIFA’s own budget projects that hospitality and ticketing will decline by $938 million in the 2027-2030 cycle, even as total revenue climbs. The 2026 gate is a peak FIFA doesn’t expect to see again.
The backlash arrived on cue. New York and New Jersey attorneys general have subpoenaed FIFA over its ticket practices. Meanwhile, host cities like Boston and Kansas City are covering tens of millions in security and transport while FIFA keeps the upside at the gate.
Cities take the bet for a reason. Each US host is promised between $160 million and $620 million in local spending from visiting fans, plus local jobs and a month in the global spotlight. A summer of full hotels and busy restaurants is real money.
But the payoff may not arrive as advertised. Victor Matheson, a sports economist at Holy Cross, calls FIFA’s projections closer to a press release than serious analysis. Much of the spending that does show up may have simply shifted from somewhere else. For an economy of America’s size, the whole tournament barely registers, well under 0.1% of GDP.
The controversy goes beyond prices and public costs. Human-rights groups have also warned about risks around immigration enforcement, policing, freedom of expression, and the treatment of local communities during the tournament. FIFA markets the World Cup as a global celebration, but the 2026 edition arrives with a heavier political backdrop than usual.
A major growth driver for FIFA has been the 2025 Club World Cup. FIFA expanded it to 32 teams and staged it in the US, creating a second marquee event to smooth the four-year sawtooth.
The $1 billion Women’s World Cup revenue target in Brazil in 2027 points in the same direction: more global events, more premium pricing, and more predictable revenue between men’s World Cups.
Takeaway: The 2023-2026 cycle is where FIFA became less dependent on a single event and more like a portfolio of scarce global sports rights. But maximizing revenue comes with controversy. Teams collect record checks. Fans are asked to pay more. FIFA may keep finding new ways to monetize football, but its own brand could be the one paying the price.
That’s it for today!
Happy investing!
Thanks to Fiscal.ai for being our official data partner. Create your own charts and pull key metrics from 50,000+ companies directly on Fiscal.ai. Save 15% with this link.
Disclosure: I do not own any stock discussed in this article in App Economy Portfolio. I share my ratings (BUY, SELL, or HOLD) with App Economy Portfolio members.
Author's Note (Bertrand here 👋🏼): The views and opinions expressed in this newsletter are solely my own and should not be considered financial advice or any other organization's views.
2026-06-09 20:03:29
Welcome to the Premium edition of How They Make Money.
Over 300,000 subscribers turn to us for business and investment insights.
In case you missed it:
That’s more than what the largest IPO in history will raise.
SpaceX is about to price the largest initial public offering ever at $75 billion, valuing the company at ~$1.8 trillion. But Alphabet, the parent company of Google, quietly topped that last week by selling new shares — upsizing a planned $80 billion raise to $85 billion after demand poured in. Berkshire Hathaway anchored it with a $10 billion investment, buying shares at a 6–8% discount.
Here’s the paradox. Alphabet sits on well over $120 billion in cash and short-term investments on its balance sheet, just generated $165 billion in operating cash flow last year, and can borrow at rates few companies on earth can match. Firms in that position almost never sell equity. Instead, they use their cash flow to buy back stock. Diluting your own shareholders is the most expensive money there is, a slice of every future dollar of profit, forever.
So why do it? Because the AI buildout has grown so large it requires every available tool. Alphabet expects to spend $190 billion in 2026 alone, and that figure could increase by year-end.
Every company racing to build compute now stands in front of three doors:
Pay with the cash you already generate.
Borrow it (issue debt).
Sell a piece of the company (issue equity).
Each door sends a different signal about how confident you are and how much risk you are willing to take (more on this in a minute).
Today, we are looking at the three ways Big Tech is currently funding the trillion-dollar AI buildout. We’ll review which ones are good or bad for investors and what it says about where we are in this market cycle.
💵 Self-funding
🏦 Debt issuance
📉 Selling more stock
The cleanest way to fund a data center is to pay for it with money the business already makes. No interest, no dilution, no banker fees. For most of this cycle, that’s exactly what Big Tech did.
If you need a reminder, free cash flow (FCF) is the cash generated from the business, less capital expenditures (funds to buy, upgrade, or maintain physical assets). As long as FCF is positive, you are effectively self-funding your business ventures.
Free Cash Flow = [Cash from Operations – Capital Expenditures]Amazon is the textbook case for how far that model stretches. The company is on track for roughly $200 billion in capital expenditures in 2026, up from a trailing-twelve-month figure of $147 billion (+67% Y/Y).
Meanwhile, trailing-12-month operating cash flow grew to $149 billion (+30% Y/Y) at the end of March. It’s a staggering number that, a few years ago, would have funded the whole thing with room to spare. It no longer does.
Amazon is now spending essentially every dollar it generates. It was already the case in 2021 and 2022, when the company invested in fulfillment to meet pandemic-driven demand. As a result, FCF turned slightly negative in 2021 and 2022. FCF recovered to a record $38 billion in 2024 before the AI buildout cut it to $11 billion in 2025
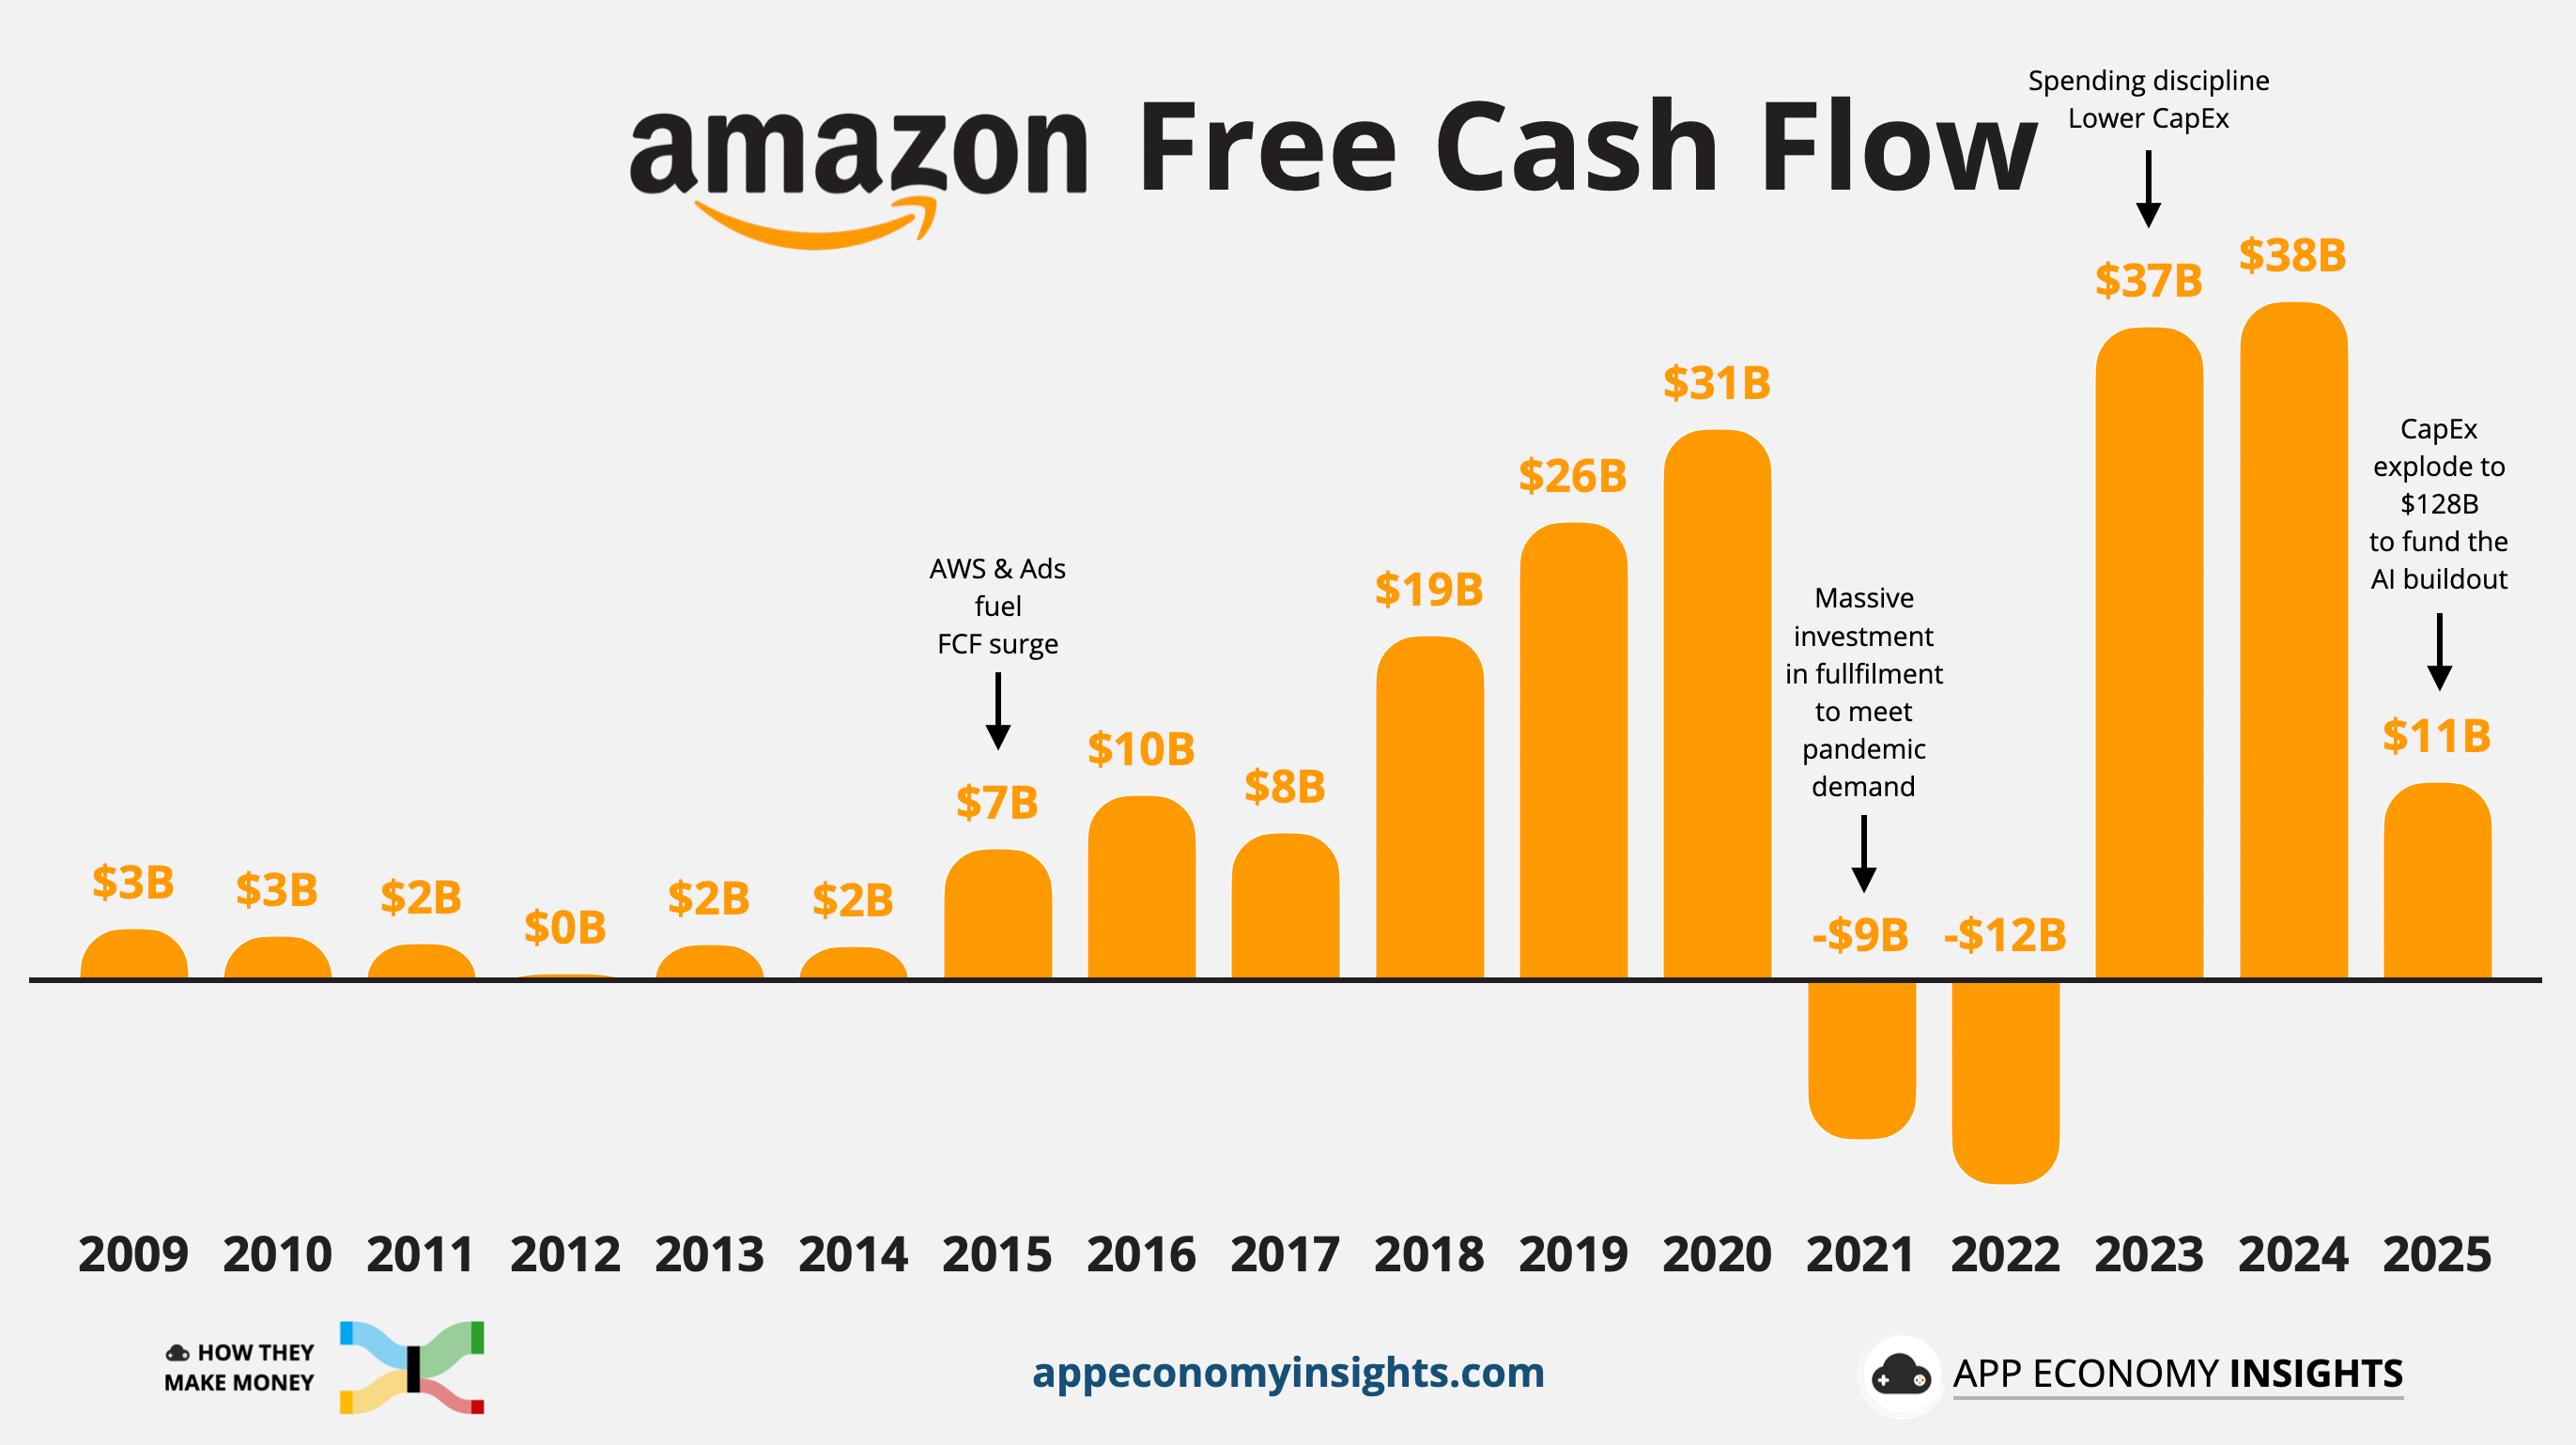
At the end of Q1 2026, trailing FCF worsened to just ~$1 billion.
“The faster AWS grows, the more short-term CapEx we’ll spend.”
That was CEO Andy Jassy on the Q1 call, and it captures the squeeze. AWS reaccelerated to +28% Y/Y, its fastest in nearly four years, but Amazon has to lay out cash for land, power, chips, and servers 6 to 24 months before it can bill a customer. Growth and free cash flow are pulling in opposite directions.
Self-funding is a position of strength: you don’t need anyone’s permission to build. The catch is that it caps your spend at what the business produces today. The AI bill is now testing that ceiling everywhere. Microsoft, Meta, and Alphabet still fund most of their CapEx from existing operations. The open question is what happens when one great business can no longer feed an even hungrier one.
Takeaway: Free cash flow is the cheapest capital and the proudest signal — it says the core business can pay its own way. But when CapEx consumes more than 100% of operating cash flow, the wallet is empty, and the next dollar has to come from somewhere else.
2026-06-06 22:02:53
Welcome to the Saturday PRO edition of How They Make Money.
Over 300,000 subscribers turn to us for business and investment insights.
In case you missed it:
📊 Monthly reports: 200+ companies visualized.
📩 Tuesday articles: Exclusive deep dives and insights.
📚 Access to our archive: Hundreds of business breakdowns.
📩 Saturday PRO reports: Timely insights on the latest earnings.
Today at a glance:
📈 Broadcom: AI Bookings Triple Shipments
🖥️ HPE: AI Demand Pulls Forward
🧑⚕️ Veeva: Falcon Targets Agentic Labor
🌐 Samsara: Operational AI Scales
🔷 Rubrik: Agentic Cyber Resilience
🧘🏻 Lululemon: Turnaround Stalls
🛠️ GitLab: AI Pivot With Layoffs

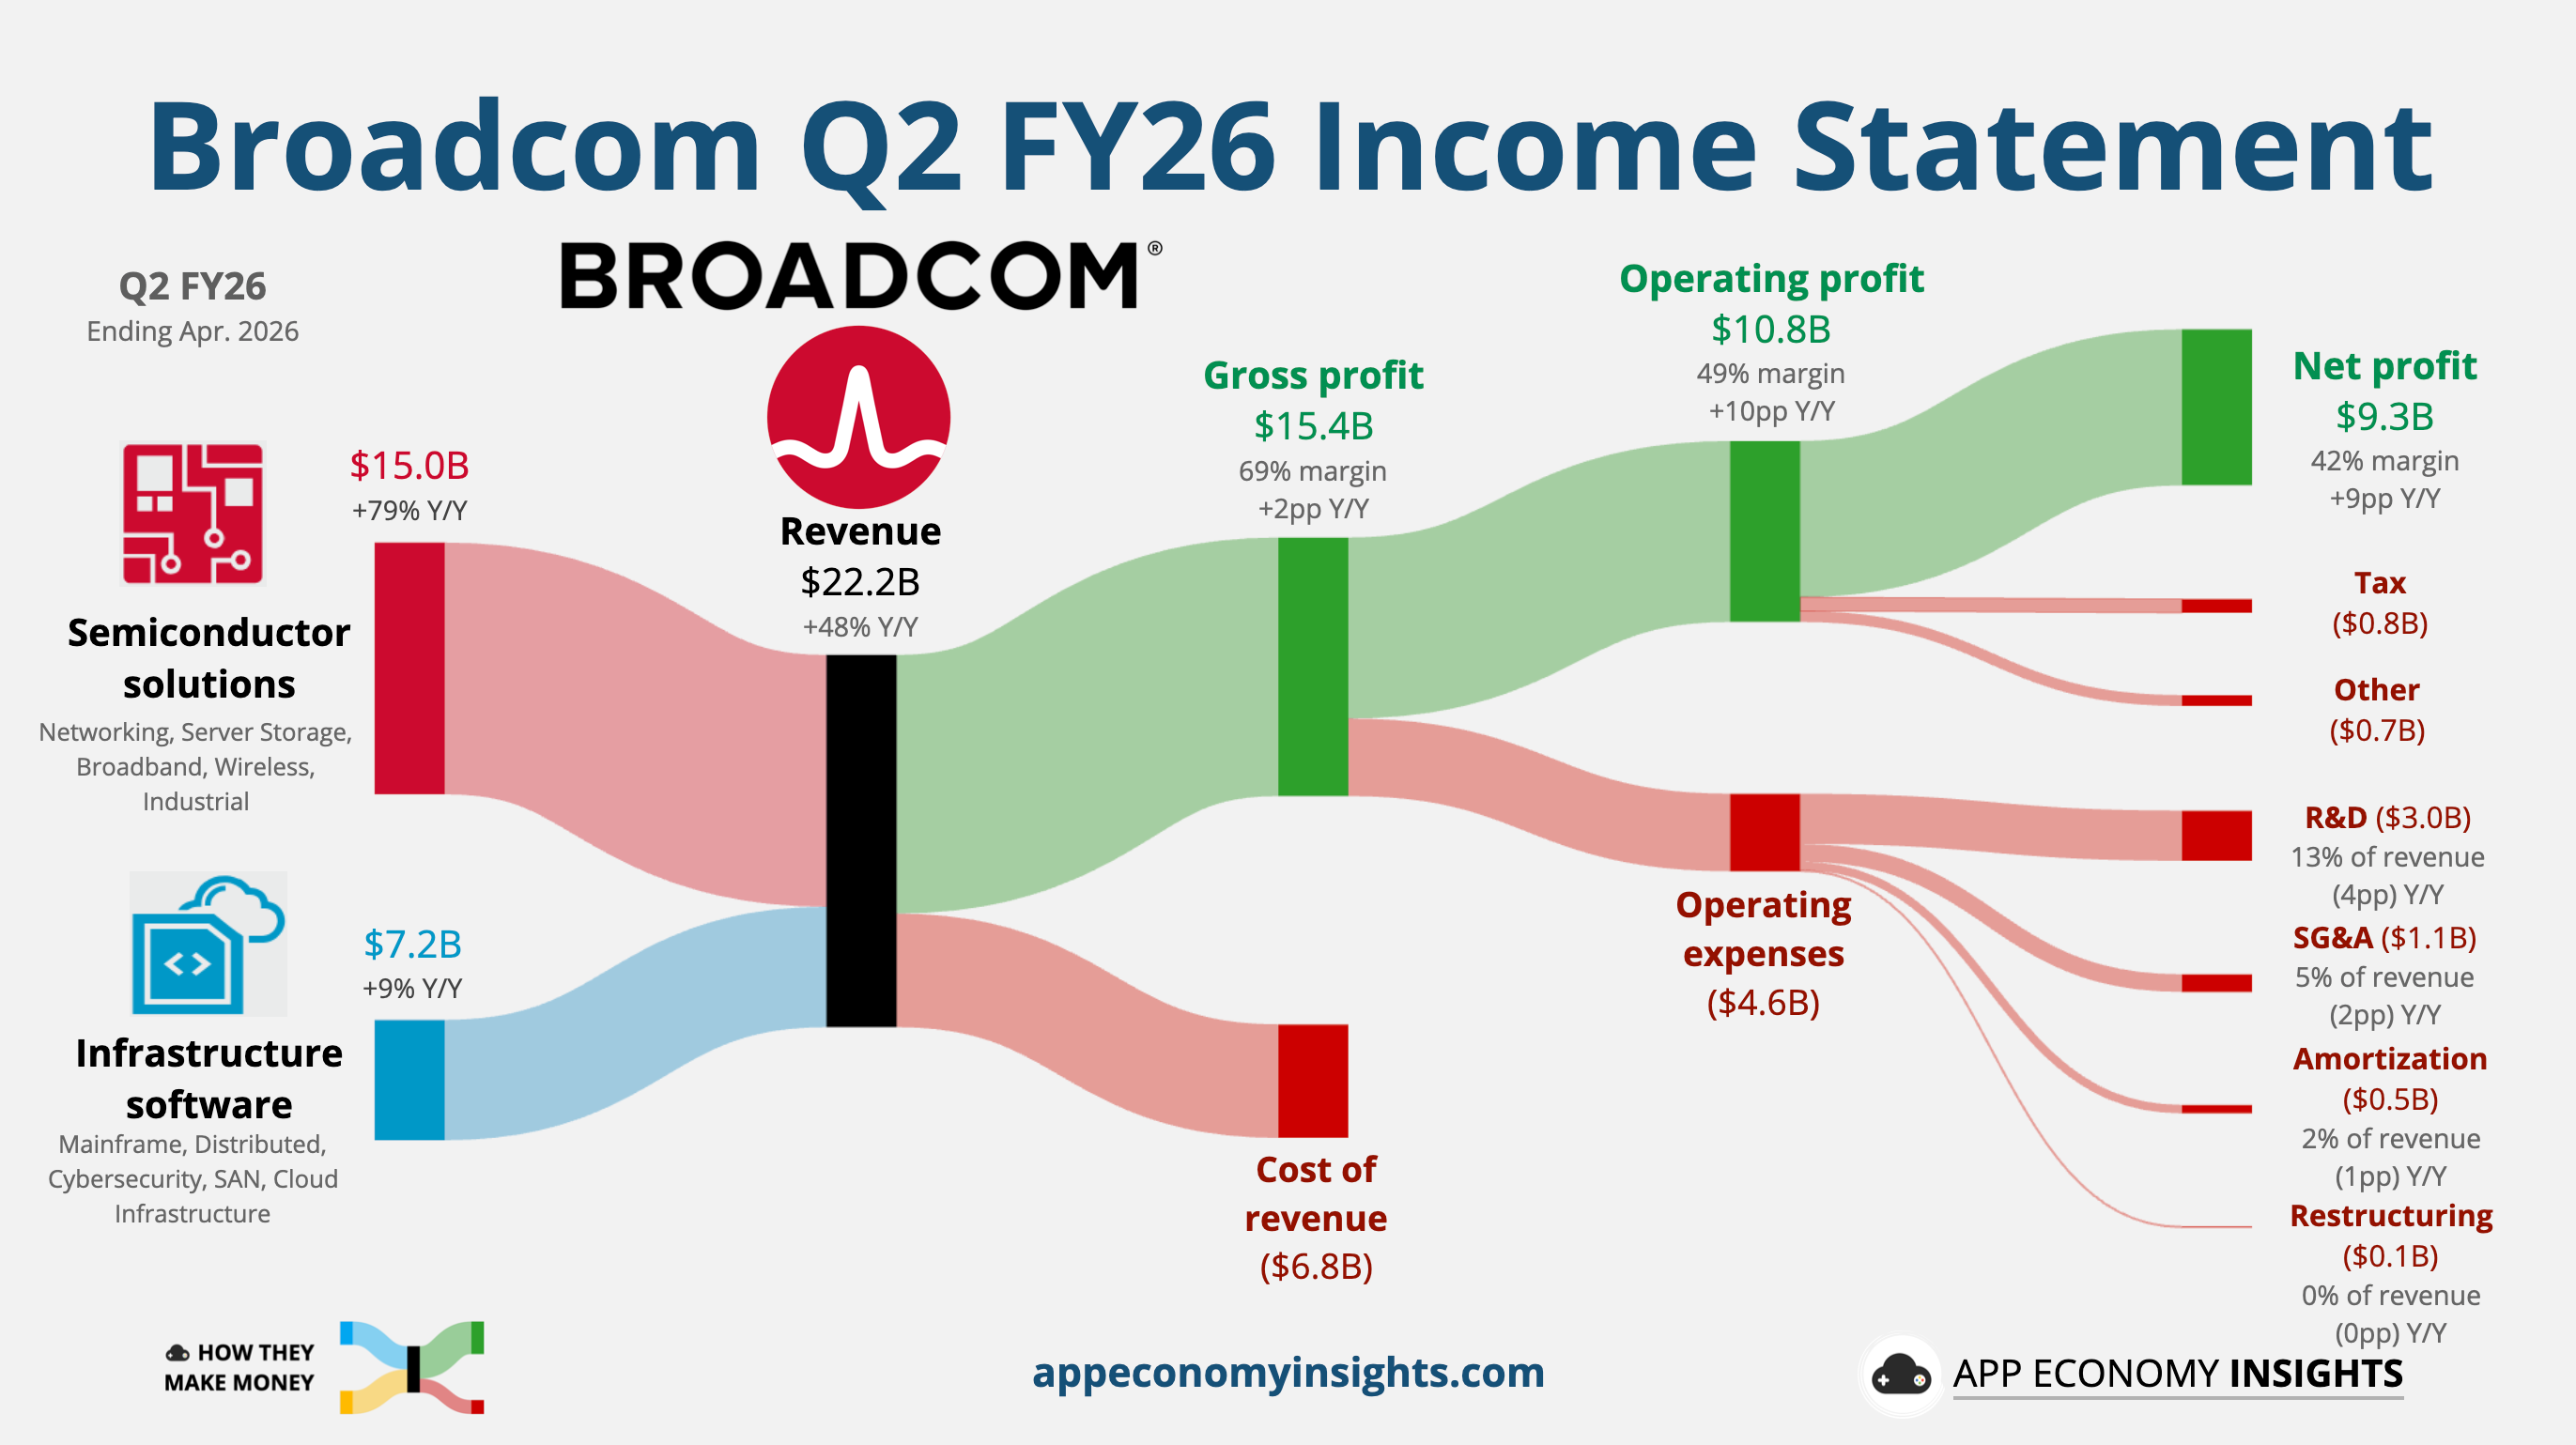
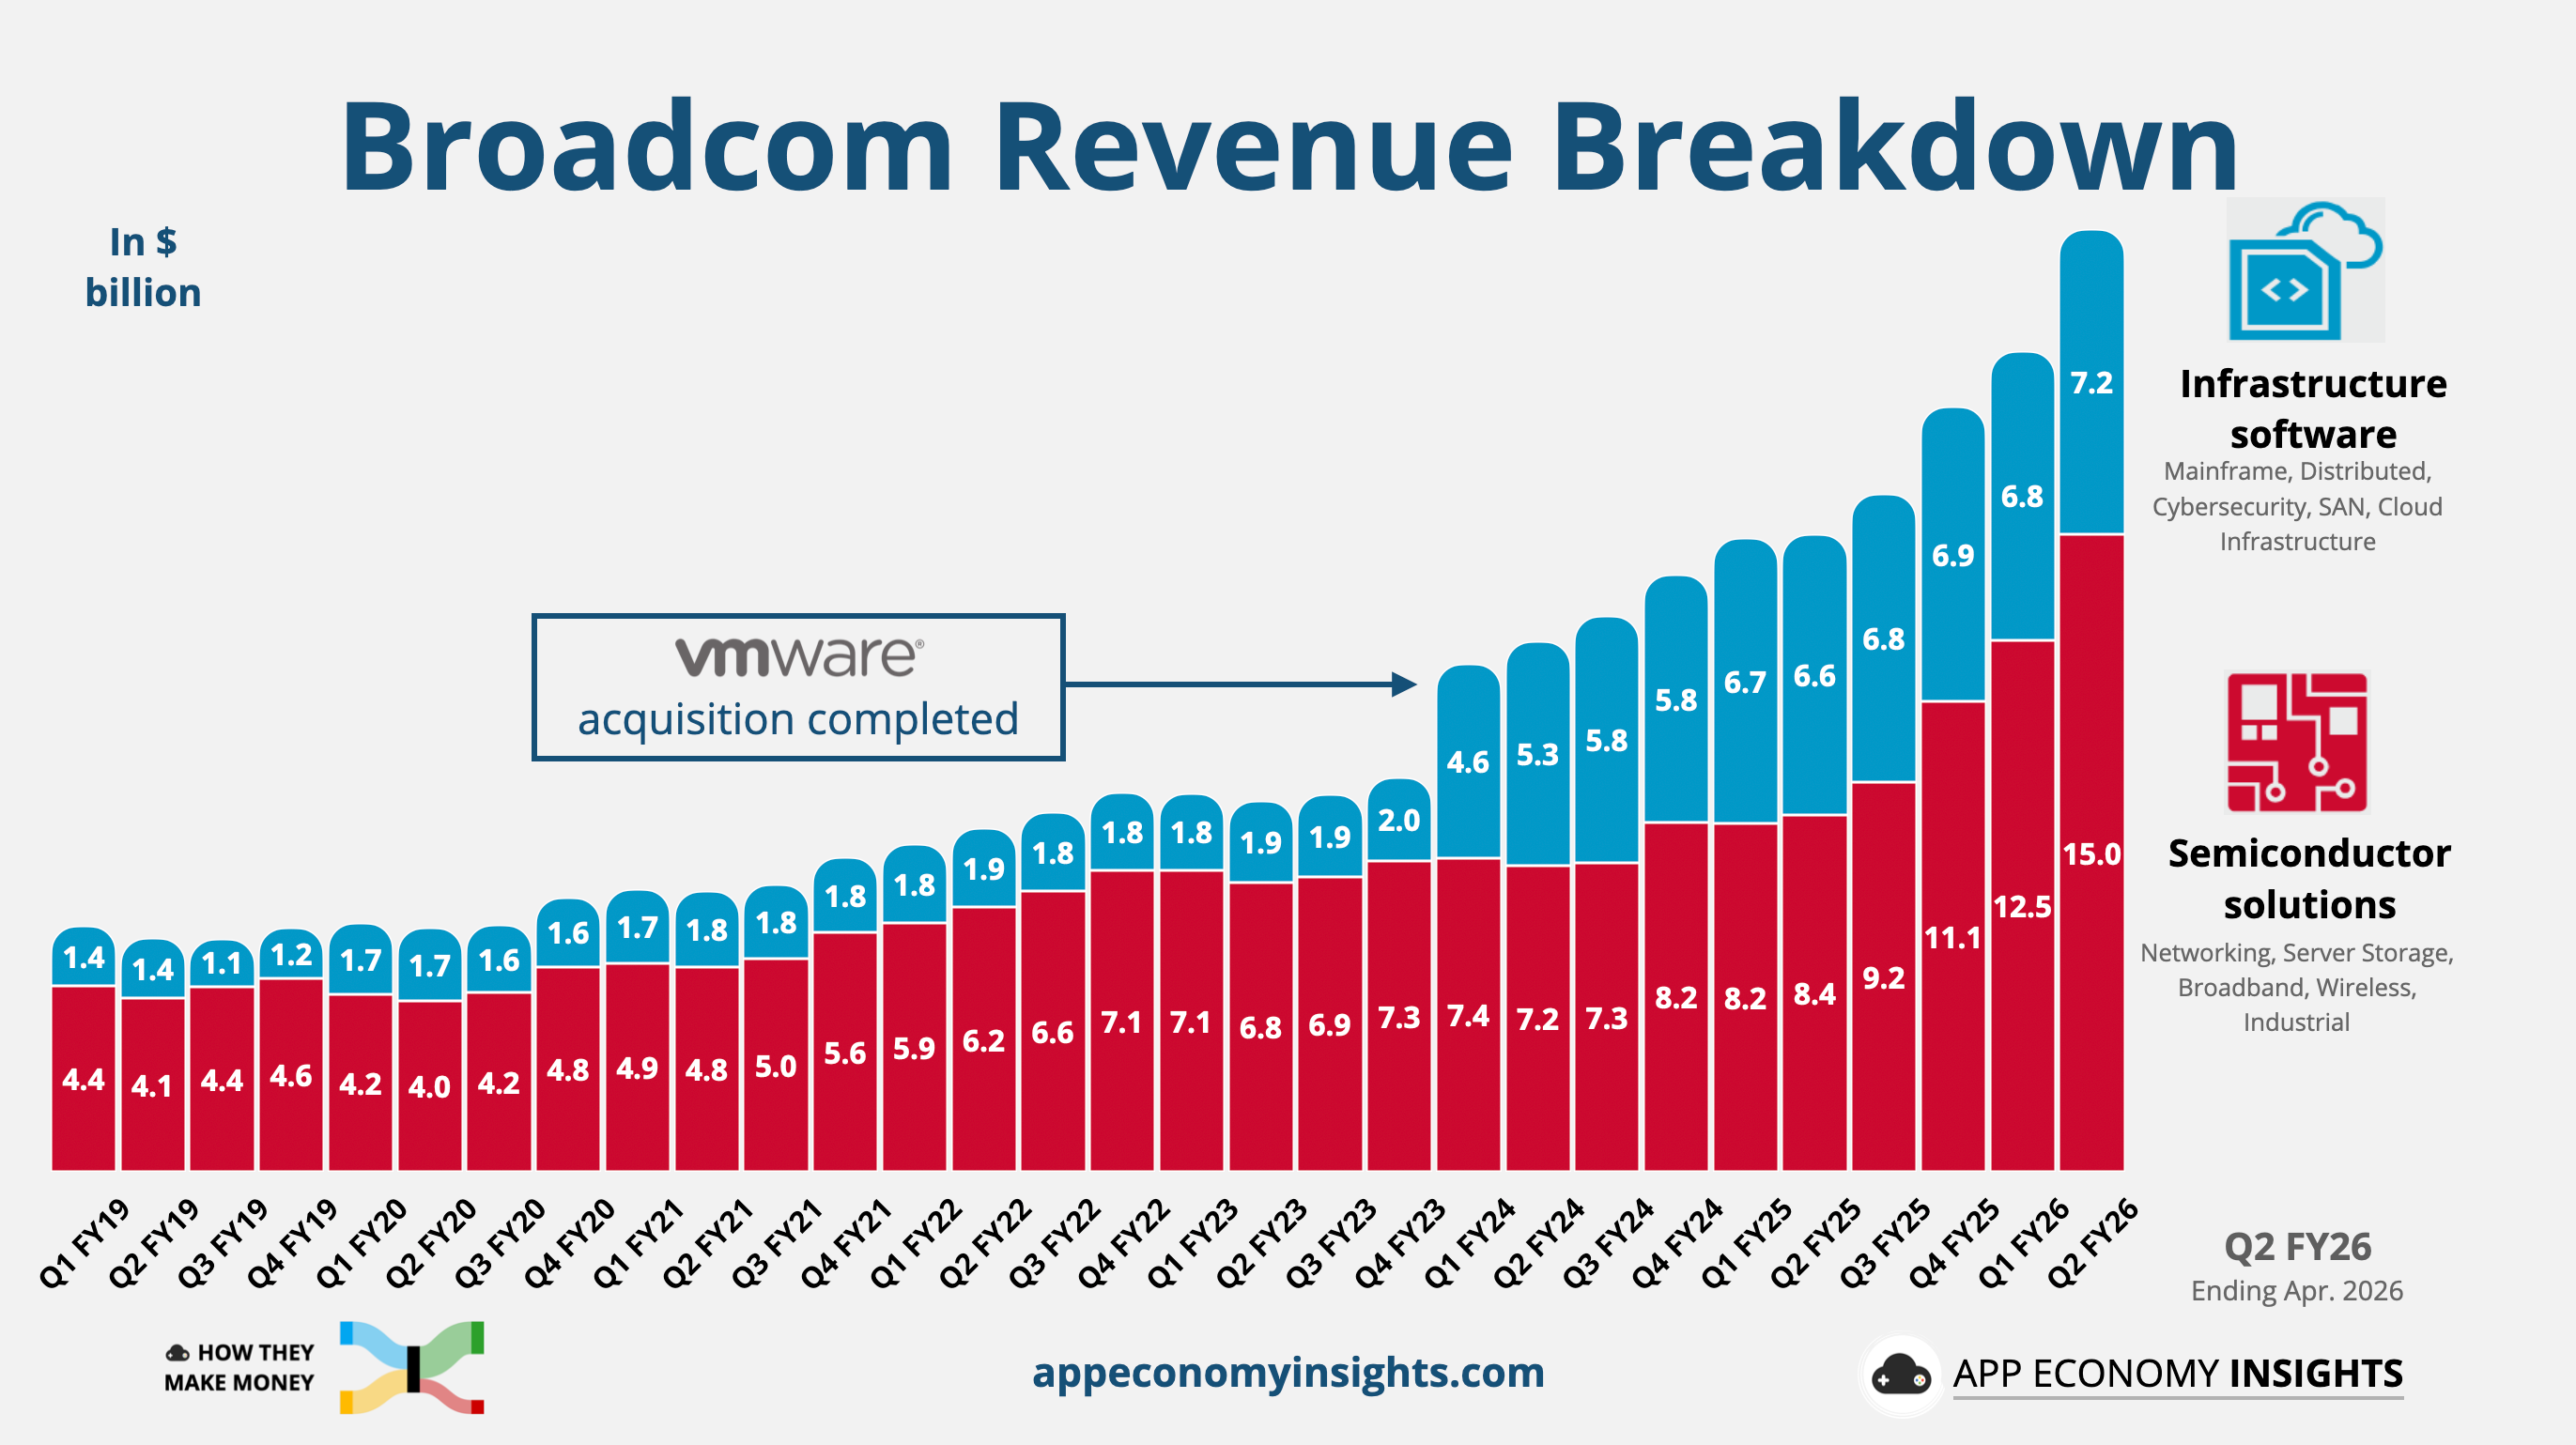
Broadcom's Q2 revenue rose 48% Y/Y to $22.2 billion ($70 million beat), with non-GAAP EPS of $2.44 ($0.04 beat).
Semiconductor solutions as a whole grew 79% to $15 billion, driven by AI semiconductor revenue, which jumped 143% Y/Y to $10.8 billion.
Infrastructure software grew 9% to $7.2 billion.
Operating margin hit a record 49%, and free cash flow reached $10.3 billion (46% of revenue). Shares still fell nearly 15% post-earnings, giving back most of the $270 billion in market cap added over the prior five sessions.
Broadcom is seen as a major beneficiary of Google's announcement earlier this week that it is raising ~$85 billion in equity to fund its AI infrastructure buildout. Google is one of Broadcom's six core custom XPU customers.
For Q2, Broadcom’s headline metric was order velocity. AI semiconductor bookings exceeded $30 billion, roughly three times what the company shipped, with CEO Hock Tan saying “our visibility runs all the way to 2028.” AI networking accounted for nearly 40% of AI revenue, though Tan expects this to normalize toward 30% as custom XPUs ramp.
Expectations were sky-high ahead of the print:
Q3 AI semiconductor guidance of $16 billion implies a 200% Y/Y growth, but it missed the $17.2 billion buy-side estimate.
Tan implied full-year FY26 AI revenue of around $56 billion, which was short of the $57.6 billion consensus.
The $100 billion FY27 AI target was reiterated during the call, but not raised.
Multi-year customer commitments are real but back-end loaded into late FY27 and FY28.
Broadcom announced major customer-specific deployments:
1.3 GW for OpenAI in 2027 (part of a 10 GW deal through 2029).
3 GW for Meta through the end of 2028 (with the first 1 GW starting in H2 2027).
A $35 billion debt financing deal with Apollo and Blackstone to fund Anthropic's purchase of Google TPU chips that Broadcom helped develop, with Broadcom backstopping the largest portions of the transaction. The arrangement is part of a broader AI XPU Platform targeting 20+ GW of LLM compute capacity through 2028.
Broadcom guided Q3 revenue to $29.4 billion (vs. $28.47 billion consensus), with semiconductor revenue at $20.5 billion (up 124% Y/Y).
The sell-off was primarily about Broadcom failing to raise its $100 billion FY27 AI revenue target, compounded by Tan acknowledging that Google will diversify its TPU supply. Investors are left wondering whether management is staying cautious to set up future beats or whether the strength in bookings is already priced in.
2026-06-05 20:02:35
Welcome to the Free edition of How They Make Money.
Over 300,000 subscribers turn to us for business and investment insights
In case you missed it:
Palo Alto Networks and CrowdStrike are the two largest pure-play cybersecurity companies in the world, and they reported a day apart this week with almost the same script: strong results, higher guidance, and a stock that fell anyway.
Both stocks had rallied more than 50% into earnings as investors embraced the same thesis: AI is becoming a tailwind for cybersecurity.
The trigger was Anthropic’s Mythos, the model judged too dangerous to release widely, which sent enterprises scrambling to reassess their defenses.
The numbers suggest the AI security thesis is real. The problem is that the investors already knew it.
Today at a glance:
☁️ Palo Alto: Buying the AI Security Era
🦅 CrowdStrike: The Mythos Moment
Palo Alto delivered a strong quarter, but the headline numbers were messy.
Revenue grew 31% Y/Y (or 14% organically) to $3.0 billion ($60 million beat), and non-GAAP EPS landed at $0.85 ($0.05 beat).
The company also reported an unusual $183 million operating loss, but that was mostly deal-related noise from the recent $25 billion CyberArk acquisition and the Chronosphere deal. New acquisitions added roughly $280 million of intangible amortization and $198 million of deal costs this quarter alone.
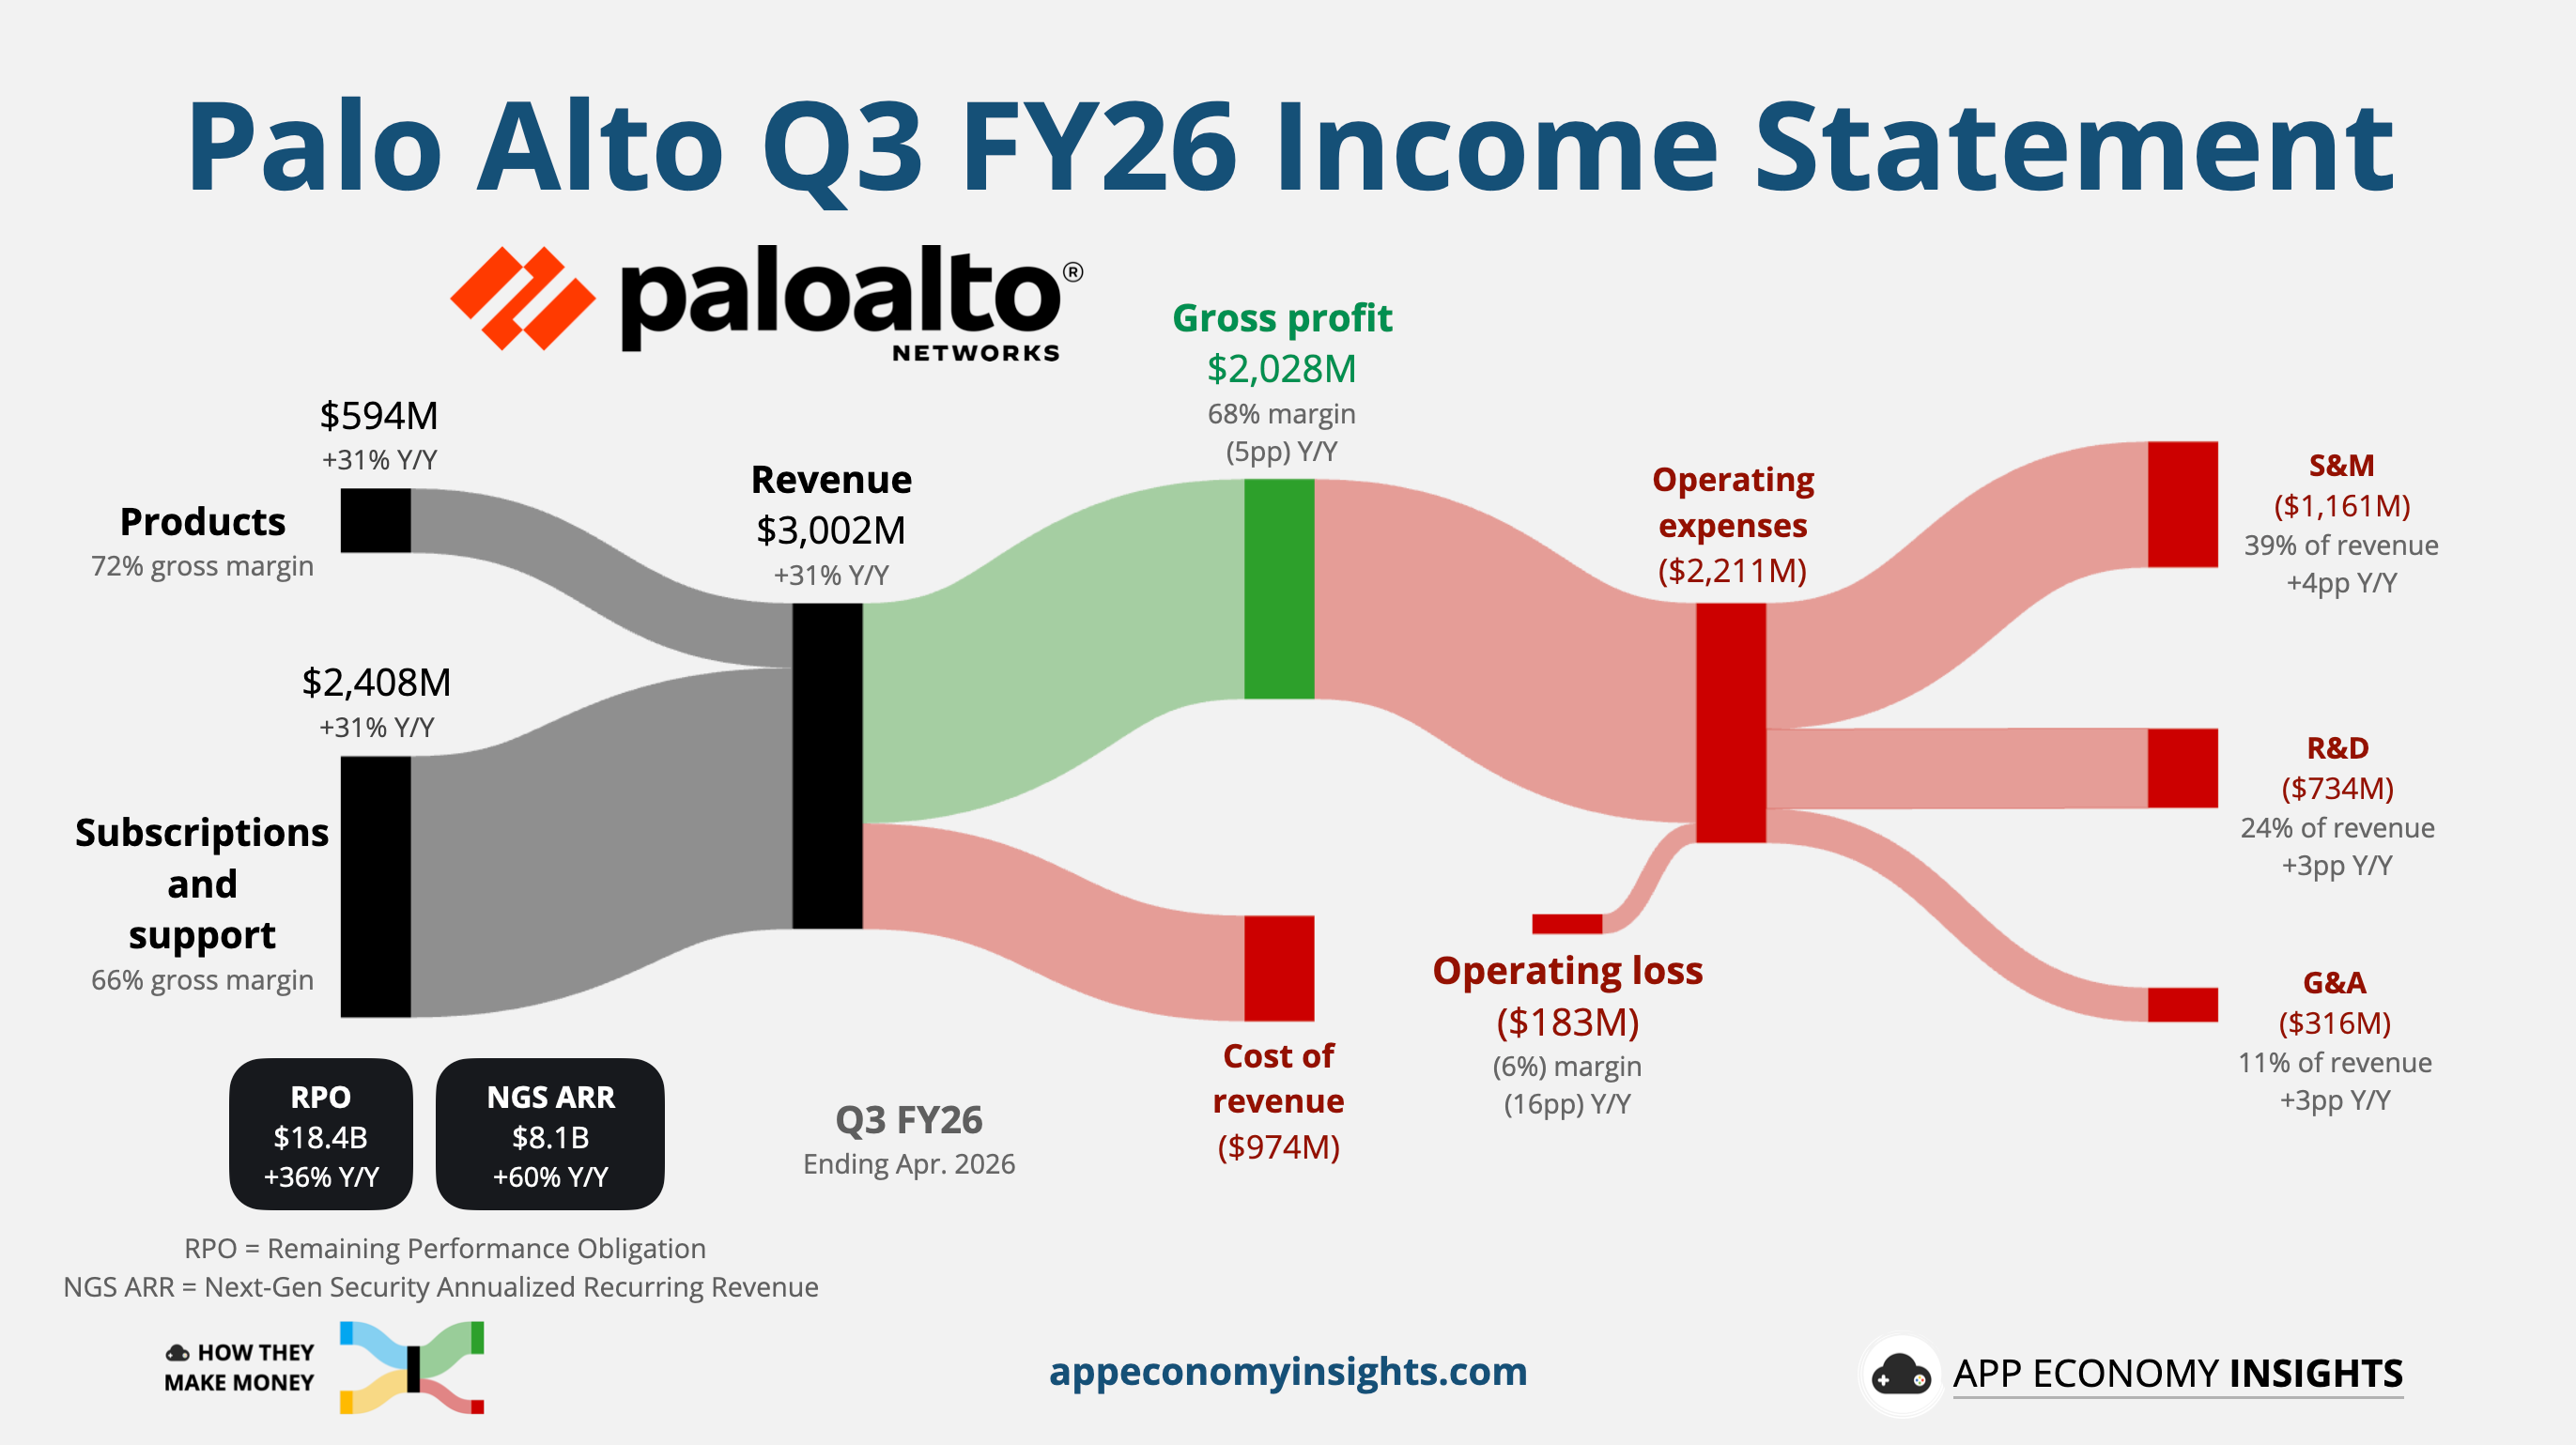
Cash flow told a cleaner story. Operating cash flow rose 39% Y/Y to $871 million, while adjusted free cash flow hit a record $910 million, up 57% Y/Y. The trailing-12-month free cash flow margin reached 38.5%, up 4.3 percentage points Y/Y.
Management leaned into the early-2026 SaaSpocalypse selloff, spending $1 billion on 6.8 million shares at an average of ~$148 — nearly half today’s price. When you’re that sure the panic is wrong, you buy. That’s also why we built a larger PANW position at the time in App Economy Portfolio.
Did Palo Alto buy its way into the AI security era at the right price?
So far, the answer looks encouraging.
Strip out the acquisition noise, and the organic numbers look healthy:
Next-Gen Security (NGS) ARR: $8.1 billion, up 28% organically.
Remaining performance obligation: $18.4 billion, up 22% organically.
Organic growth matters because it shows that the CyberArk deal did not mask a slowdown. The forward-looking metrics show Palo Alto is still signing large customers, expanding its backlog, and converting more of the business to recurring revenue.

CEO Nikesh Arora framed AI as a forcing function. Frontier models are making companies rethink their defenses, especially as AI agents gain access to credentials, data, and internal systems.
The demand signal is already showing up. Roughly 1,000 companies reached out over two months to reassess their cyber posture, and the new Unit 42 Frontier AI Defense offering generated 800+ customer meetings in six weeks.
Palo Alto is also turning the threat into a tool. With early access to frontier models, the company says it can compress a year’s worth of penetration testing into under three weeks.
But Arora’s most important point was more grounded: AI still makes mistakes. Frontier models can hit error rates near 25% and fail at the last mile of complexity. In cybersecurity, that gap matters. Attackers only need to win once, and one wrong enforcement call can take down a production network. In short, AI expands the attack surface, but customers still need a trusted platform to manage the response.
Palo Alto’s pitch is to replace a dozen point products with one platform, trading upfront discounts for stickier, multi-year commitments.
The strategy is working:
110 net new platformizations this quarter, lifting the total to ~2,280.
120% net retention with single-digit churn. That’s exactly what justifies large onboarding discounts.
Firewall bookings rose across appliances (+40% Y/Y, the strongest hardware quarter in a decade) and software (+25%).
The legacy firewall business still matters, but the mix is changing. 46% of trailing-12-month product revenue is now recurring software, up from 22% three years ago. That transition is the key. Palo Alto is using its firewall footprint to pull customers into a broader subscription platform.
The acquisitions are the clearest sign of where Palo Alto thinks cybersecurity is going. The company is trying to own the full stack before the market fully forms.
Identity: CyberArk, now rebranded Idira, gives Palo Alto a stronger identity layer for humans, machines, and AI agents. As agents spread, credentials become one of the fastest-growing attack surfaces.
Security operations: Cortex XSIAM crossed $600 million ARR, up roughly 100% Y/Y, with more than 740 customers as it displaces legacy SIEM tools.
AI runtime: Prisma AIRS topped 300 customers, tripling sequentially, with a $20 million-plus enterprise deal already signed.
Management raised the full-year outlook for the third straight quarter:
FY26 revenue guidance increased to $11.42 billion ($60 million raise), while non-GAAP EPS moved to $3.77–$3.79 (up from $3.65–$3.70).
Longer term, management still expects a 40% free cash flow margin by FY28 and $20 billion in NGS ARR by FY30. CFO Dipak Golechha also flagged rising memory and storage costs, with a 10% increase in hardware prices now baked into the guide.
Takeaway: Palo Alto’s AI security pitch is credible because the organic engine is still strong. The CyberArk deal adds complexity, but it also gives Palo Alto a better shot at owning identity in the agent era. Arora has earned the benefit of the doubt. The risk is valuation: after a nearly 50% rally this year and a stock near 62x forward EBITDA, investors are already pricing in a clean integration.
CrowdStrike delivered the cleanest validation of the AI thesis yet: Q1-record net new ARR and higher guidance on every line.
After surging over 60% in the month leading up to the print, the bar was set for a flawless report, and a merely excellent one wasn’t enough. The stock fell more than 10%.
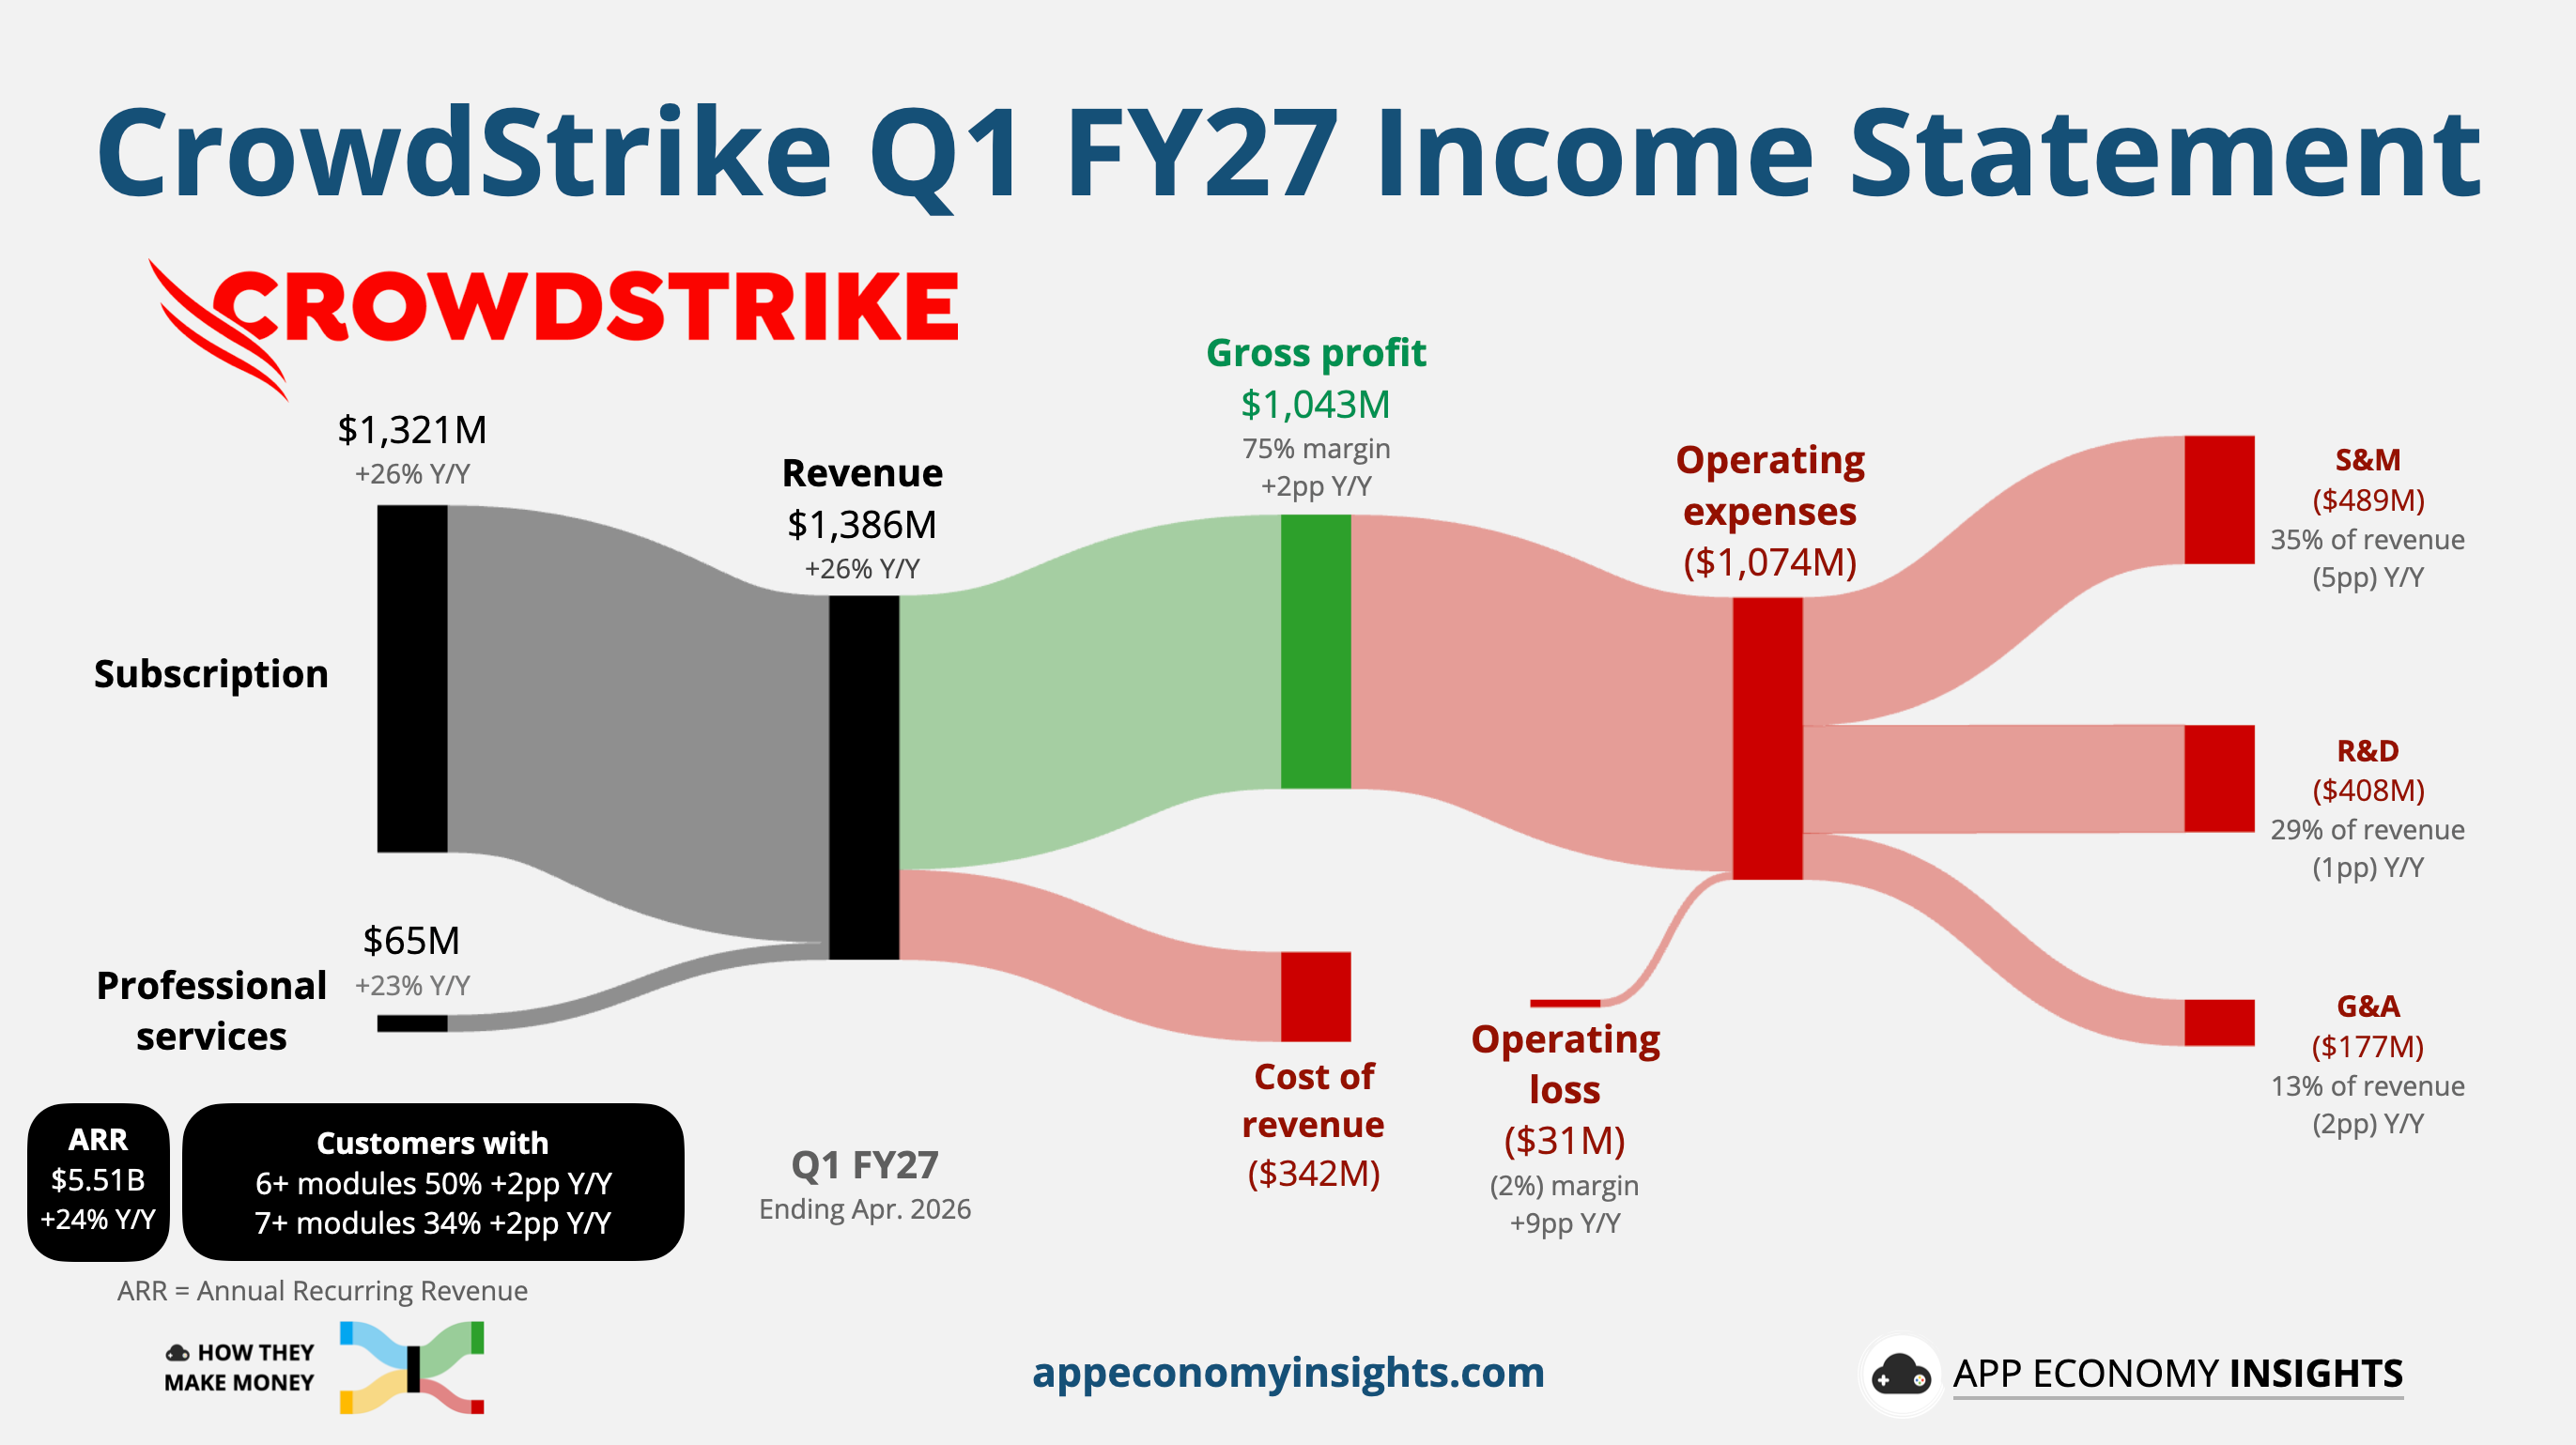
Revenue grew 26% Y/Y to $1.4 billion ($30 million beat), the fourth straight quarter of acceleration, and non-GAAP EPS landed at $1.10 ($0.03 beat). Margins improved across the board, with the operating loss narrowing to $31 million (from $125 million a year ago).
Free cash flow hit a record $468 million, a 34% margin and an all-time high, lifting CrowdStrike’s Rule of 40 score to 59. Stock-based compensation remains a significant factor, accounting for 21% of revenue and showing little improvement over time.

The recurring-revenue engine is the main KPI:
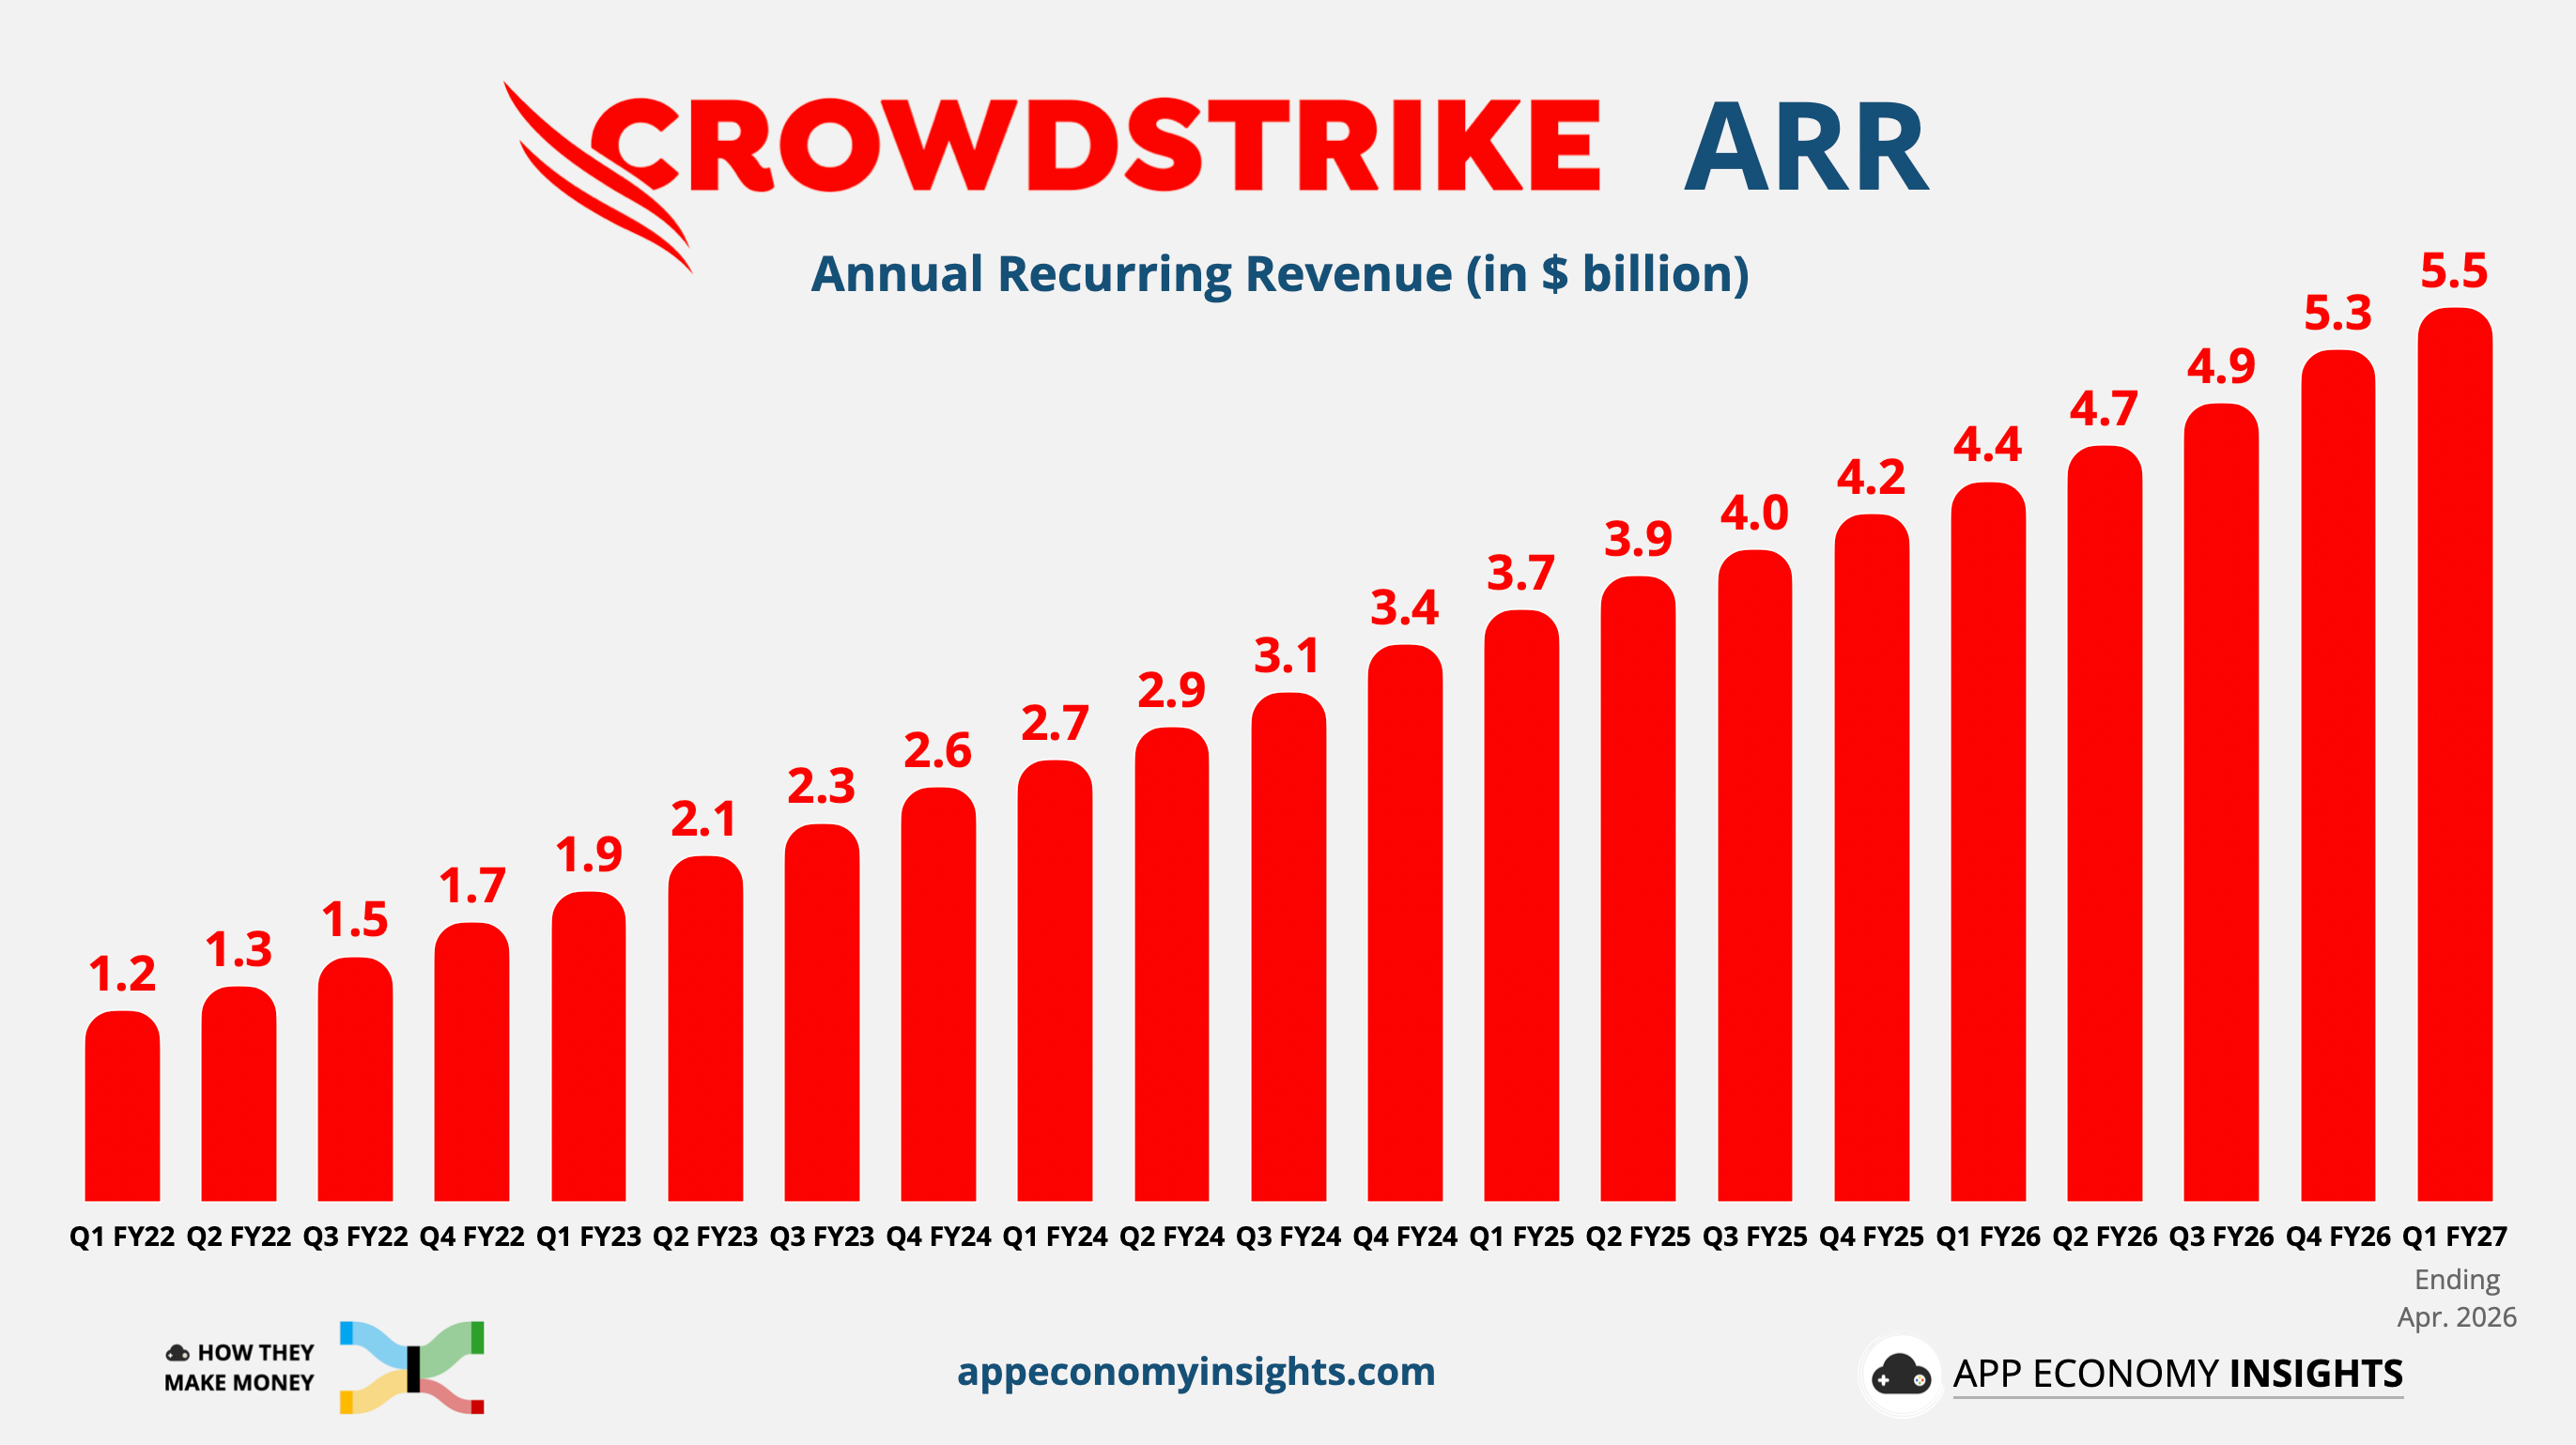
Ending ARR rose 24% Y/Y to $5.51 billion, well past the halfway mark toward the $10 billion target set at its 2023 Fal.Con briefing.
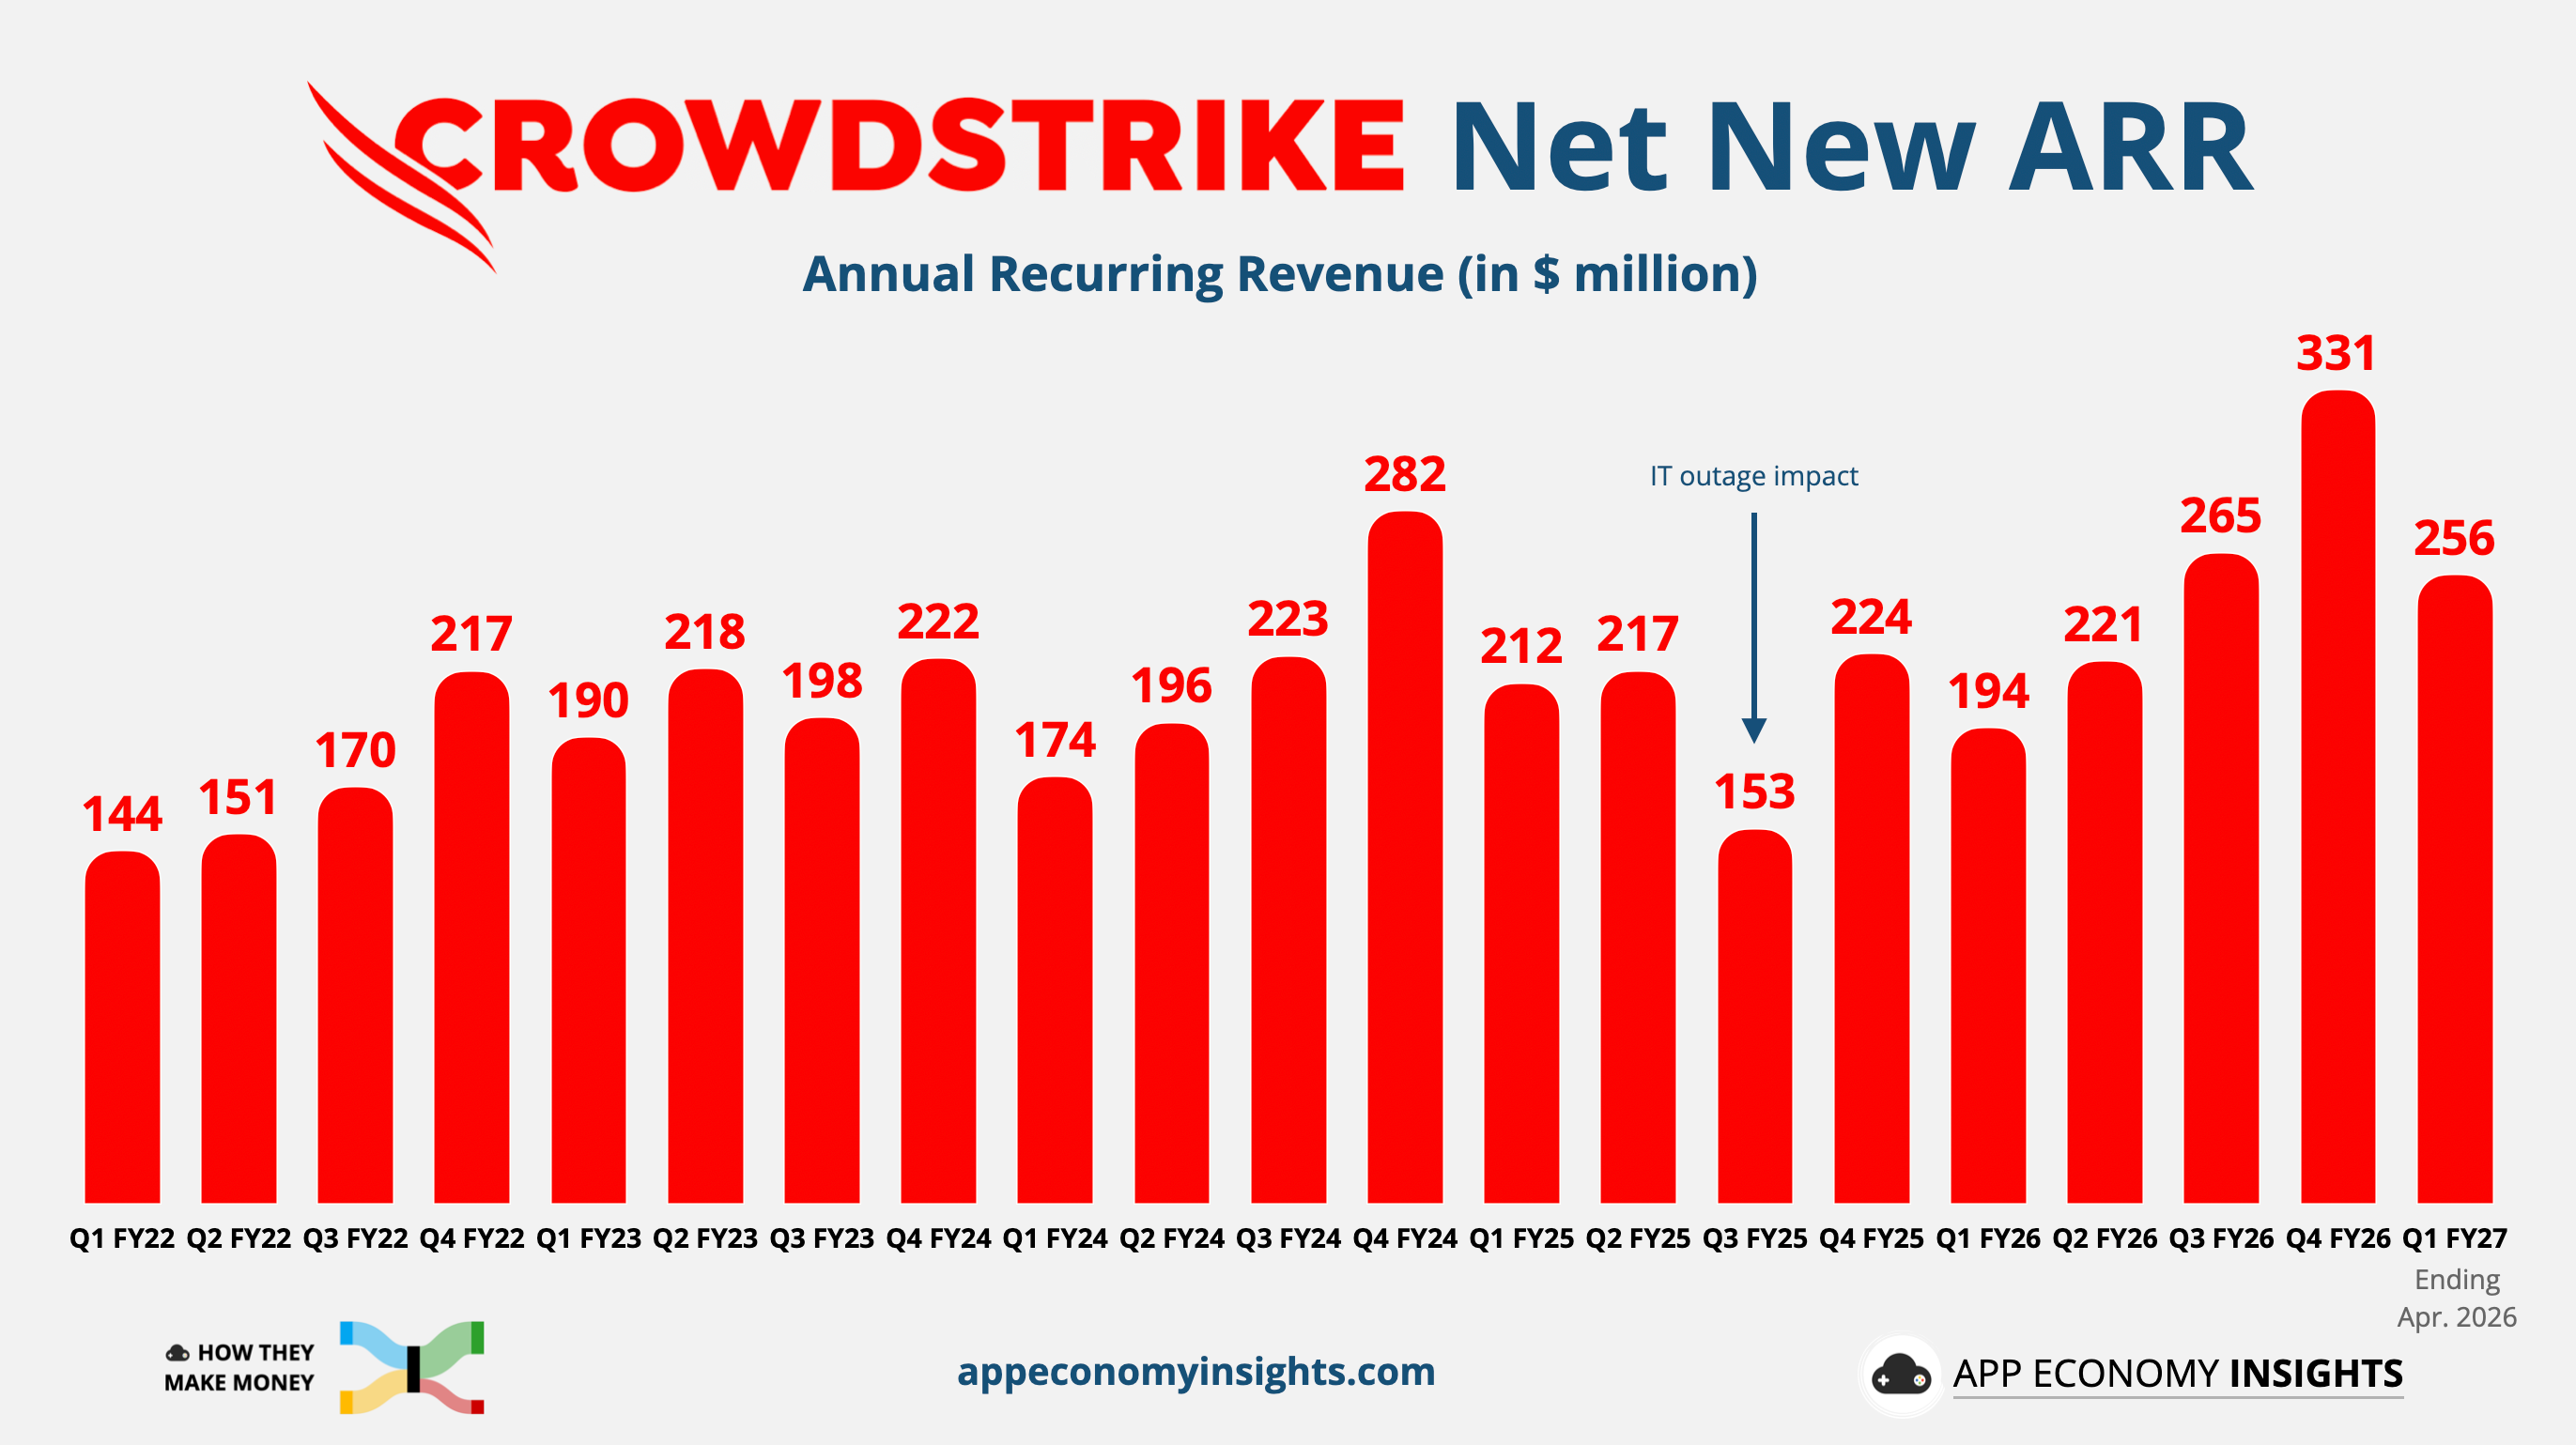
Net new ARR, the quarter’s fresh recurring revenue and the truest read on momentum, hit a Q1-record $256 million (+32% Y/Y). Q1 is the weakest quarter seasonally, making the numbers all the more impressive.
The thesis CEO George Kurtz has pushed for a year is now the customer’s thesis. Enterprises increasingly treat CrowdStrike as AI security infrastructure rather than a line item. Post-Mythos, executive-level inquiries surged, and the company stood up Project QuiltWorks, a coalition that helps large customers find and fix vulnerabilities in real time.
It also created a Chief AI and Autonomous Systems Officer role, poaching Bartley Richardson from NVIDIA. It illustrates where CrowdStrike thinks the platform will head over the next decade.
With Falcon Flex, customers commit a security budget upfront and then spend it across modules over time. It remains the consolidation flywheel. The company added 300+ Flex accounts, and Flex ARR nearly doubled to $1.9 billion (more than a third of overall ARR).
Customers who burn through their Flex budget early come back and commit more.
480 ReFlex customers (~25% of Flex accounts) lifted ARR by an average of 26%.
130+ have ‘reflexed’ more than once, for an average 51% uplift over their original commitment.
CrowdStrike is racing to own the attack surfaces AI is creating.
AIDR (AI Detection and Response): Ending ARR grew +250% sequentially, with a Q2 pipeline above $50 million. Kurtz called the ramp the fastest of his career and pegged AIDR as a market potentially larger than endpoint detection itself, as AI agents multiply.
Next-Gen SIEM: Ending ARR topped $600 million, and combined with cloud and identity now exceeds $2 billion.
FalconShield: ARR nearly quadrupled Y/Y as customers scramble to secure AI agents operating inside their SaaS apps.
Management raised the full year on every line. FY27 ARR is now expected to grow +25% Y/Y. Net new ARR guidance rose by more than $50 million, which Kurtz framed as the AI tailwind in action. The Q2 guidance came just in line, though.
Takeaway: AI is turning cybersecurity from a defensive budget line into a strategic priority. Palo Alto is buying its way deeper into identity and agent security, while CrowdStrike is expanding Falcon into AI-native infrastructure. The thesis is working. The stocks are the hard part. After massive rallies, expectations have caught up with the story, and the valuations leave little room for error.
That’s it for today!
Happy investing!
Thanks to Fiscal.ai for being our official data partner. Create your own charts and pull key metrics from 50,000+ companies directly on Fiscal.ai. Save 15% with this link.
Disclosure: I own PANW and CRWD in App Economy Portfolio. I share my ratings (BUY, SELL, or HOLD) with App Economy Portfolio members.
Author's Note (Bertrand here 👋🏼): The views and opinions expressed in this newsletter are solely my own and should not be considered financial advice or any other organization's views.