2026-06-29 23:29:57
The short version: The Model Context Protocol (MCP) is an open standard that allows any AI application to interact with any external system — files, databases, APIs, all of it. Anthropic first put it out at the end of 2024, and within roughly 18 months MCP became the industry-wide standard for plugging AI applications into the rest of the stack. This article walks through what MCP really addresses, how it works internally, and how it compares to function calling and RAG.
Every AI application has the exact same issue. The model as presented is very smart, but completely unable to remember things, access your documents, send messages, or even know what events are scheduled on your calendar. In short, the entire game in 2024 and 2025 was figuring out how to integrate the model with everything outside of itself.
Until late 2024, every team was solving this the brute-force way. Each AI application built a custom integration for every tool it wanted to talk to. If there were M different AI applications and N different tools, the result was M × N separate bespoke integrations. Every team that wanted to plug an AI app into their tech stack Slack wrote their own bindings. That is not engineering. That is a massive pile of unnecessary repetitive plumbing
MCP — the Model Context Protocol — is the answer. It turns M × N into M + N. One protocol, one spec, and any compliant client can talk to any compliant server.

The official comparison between MCP and USB-C sounds like marketing fluff until you sit with it. USB-C did not just change the shape of the port on the back of your laptop. It represented a real improvement over the way devices used to talk to each other. Before USB-C, every device had its own port. Laptops had one charger. Phones had another. Headphones had a third. The connectors themselves worked well enough, but manufacturers still had to develop additional hardware (chargers, adapters, dongles) before consumers could use those devices together.
USB-C did not make any device smarter. It made the connection between devices stop being a problem. Today you plug your phone into your laptop's video output port and it just works. No dongle. No driver hunt.
The same thing is happening to AI. MCP did not make the model smarter — the model gets smarter every quarter regardless. What did not have a standard was the socket. MCP is the socket.
MCP defines three roles:
A single host can spin up many clients. Each client talks to exactly one server. Servers can be local (a Python script running on your laptop) or remote (a hosted endpoint reachable across the network).
Why split client and server? Because the server is what the capability owner writes — the Slack team, the GitHub team, your own internal data team. They ship one server, and every MCP-compatible host instantly knows how to use it. The client is boilerplate the host runs without having to think about it. It exists so the capability owner does not have to care which host is calling.

This is the part most explainers tend to gloss over, and it is what really makes MCP different from "yet another function calling specification."
APIs for function calling provide tools. RAG provides resources. Prompt libraries provide prompts. MCP provides all three behind one interface, and includes the metadata to discover what is available at runtime.
That last piece — runtime discovery — is really what makes MCP feel different in practice. The host does not need to know what a server can do at compile time. It connects, asks "what have you got?", and the server returns a typed capability surface. With that, new tools can appear without redeploying anything on the client side.

The wire protocol is JSON-RPC 2.0 over a persistent bidirectional channel. Strip the formality away and an interaction looks like this:
1. The host launches an MCP server (local subprocess or remote endpoint).
2. Client and server complete an initialize handshake — they trade protocol version, capabilities, and names.
3. The client requests tools/list. The server returns the catalog with JSON-Schema-typed inputs.
4. The model decides it wants a tool. The host shows the end user a permission dialog. Security lives here.
5. The user approves. The client sends tools/call with the arguments.
6. The server runs the tool, optionally streams partial results, and returns the final output.
7. The output goes back into the model's context as a tool result.
Resources and prompts follow the same shape: resources/list, resources/read, prompts/list, prompts/get. The patterns stay consistent across primitives, which is one of the genuinely well-designed parts of the spec.
Many people ask which of these to use. The honest answer is: they are not substitutes. They each serve a different purpose.
Function calling is a model capability. The model emits a structured message that says "I want to call X with these args." Function calling tells you that the model wants to invoke something. It does not tell you what tools exist, how to find them, or who will run them. MCP provides the layer below function calling — it is the communication protocol between a host and its MCP servers, allowing the host to retrieve a catalog of available tools and direct calls to the right destination.
RAG is a method for placing relevant documents inside the model's context window. It works well when your data is indexable, static, and chunkable — docs, knowledge bases, codebases. RAG breaks down when the data is live: a Slack thread happening right now, an order status that changes every second, a database whose freshness matters.
MCP is not a replacement for either. It is the connective tissue. You can build a RAG-backed MCP server (vector store exposed as a resource). You can build a function-calling host that uses MCP to discover what functions even exist. They compose.
A handful of real-world patterns:
An AI assistant on top of your own data. A Notion server, a Google Calendar server, a Gmail server, all plugged into Claude Desktop. Now your AI assistant can answer "what is stopping us from launching this week?" by reading three systems you already use every day.
AI-driven CI/CD. A GitHub MCP server exposes PR data as resources and merge/comment actions as tools. An ops server exposes deploy controls. The model reads the PRs, makes suggestions, and — when granted permission — triggers deploys.
Enterprise chat-over-data. Multiple database servers, each providing their schemas as resources and parameterized queries as tools. Users type "how much churn did we see this quarter by segment?" — the model picks the right server, pulls the schema, writes a query, runs it.
Creative pipelines for niche applications. A Blender server. A 3D-printer server. The model designs an object and prints it. This is one of the examples Anthropic uses to highlight what MCP can do, and it serves as a good reminder that MCP is not only for productivity apps.
A few honest warnings, because most explainers skip past them:
Why did MCP take off so fast? Within a year of launch, OpenAI, Google DeepMind, Microsoft, and most of the developer-tool ecosystem had shipped support. Because the alternative was unsustainable. Once you have one model that can do everything well, the bottleneck shifts to integration. The team whose model integrates with the most stuff with the least friction wins.
In December 2025, Anthropic took the final step on this and donated MCP to the Linux Foundation, where it now sits under the new Agentic AI Foundation as a vendor-neutral, community-governed standard. That is the move that turns a protocol from "a thing one company shipped" into "infrastructure." It is the same arc HTTP and TCP went through.
Anthropic understood exactly what OpenAI understood when they introduced function calling, and what the web understood when it picked HTTP as its integration layer: when the integration layer is closed, the ecosystem stalls. When it is open and governed by no one in particular, it compounds.
We are in the compounding phase right now.
If you are building: create a local stdio MCP server in the language of your choice. Official Python and TypeScript SDKs are the easiest path in. Expose the internal tool your team uses most. Plug it into Claude Desktop. You will have a working internal AI assistant by Friday.
\
If you are integrating: the official MCP Registry plus the bigger community catalogs (Glama, Smithery, mcp.so) collectively list well over 13,000 servers — Slack, Postgres, Stripe, AWS, Linear, you name it. Most are good enough to demo. The good ones — usually the first-party ones from the capability owner — are good enough to ship. Read the source before you run anything you do not recognize.
The era where every AI application had to rebuild every integration is finally over. That is the headline.
\ \ \ \ \
2026-06-29 23:26:50
Picture this: you're at a packed stadium or festival. The person next to you is watching a live stream in crisp HD while your screen is stuck on a spinning wheel. Same location, same tower, same general network. Why does one phone work and the other doesn't?
The answer comes down to a setting most carriers would rather you never learn about: QCI.
QCI — short for Quality of Service Class Identifier — is a built-in LTE network setting that decides whose data gets handled first when a cell tower is overloaded with traffic. On 5G networks, the same concept exists under the name 5QI, and it works the same way.
A simple way to picture it: imagine an airport security line where some passengers get fast-tracked while everyone else waits. The checkpoint is identical for both groups — but the wait time definitely isn't.
For regular phone plans, the relevant range runs from QCI 6 to QCI 9. The counterintuitive part is that a lower number means better treatment:
It's worth being clear about one thing: being on QCI 9 doesn't mean your connection is permanently throttled. When the tower isn't busy, a QCI 9 customer can get speeds identical to someone on QCI 6. The gap only shows up once the network gets crowded — which explains why a budget plan might feel perfectly fine at home but fall apart the moment you're in a packed venue.
There's a clear financial reason carriers don't shout about QCI. If customers understood that a bargain prepaid plan permanently puts them last in line whenever a network gets busy, many would happily pay more to avoid that.
Instead of explaining this plainly, providers tend to lean on vague phrases like "premium data" or "priority access" — language that sounds reassuring without actually telling you anything concrete.
A few providers have started breaking from that pattern by publishing their priority tiers openly, which gives customers an actual basis for comparison instead of guesswork.
Verizon keeps things fairly straightforward — most customers land in one of two buckets.
AT&T runs a four-tier structure, making it the most detailed of the major carriers.
Interestingly, many users report that AT&T's lowest tier still performs better than Verizon's equivalent, likely due to differences in overall network capacity.
T-Mobile's structure rewards its branded subscribers heavily while leaving many bargain resellers further down the list.
Mint Mobile (T-Mobile network) sits at QCI 7 — solid for light users outside dense areas, though noticeably slower than postpaid plans during peak congestion in cities.
Visible (Verizon network) starts at QCI 9 on its base plan, with the upgraded Visible+ tier bumping subscribers up to QCI 8 — putting them on par with Verizon's mid-range postpaid customers.
US Mobile (multi-network) stands out for actually publishing its priority tiers. Premium plans on its Verizon and AT&T options reach QCI 8, while entry-level plans sit at QCI 9, with a higher tier reportedly being tested for select customers.
It depends far more on where you use your phone than how much data you use.
QCI 9 is probably fine if you:
QCI 8 starts to matter if you:
QCI 7 is worth seeking out if you:
The difference can be dramatic: in a congested area, a QCI 9 user might crawl along at just a couple of megabits per second while a QCI 8 user on the exact same tower streams without a hitch. In a quiet area, both might see no difference at all.
Carriers won't volunteer this information, but there are a few ways to dig it up yourself:
QCI is one of the more consequential — and least explained — factors shaping how your phone performs in the real world. The companies that benefit most from your not knowing about it tend to be the ones spending the most on ads about how much they value you as a customer.
That's slowly starting to change as a few providers choose transparency over vague marketing language. Before signing up for any plan, it's worth asking directly: what priority tier does this plan run on? If a carrier can't or won't answer clearly, that hesitation tells you something too.
\
2026-06-29 22:11:09
The article argues that toponymy, the study of place names, is largely absent from modern education despite its cultural and historical value. It introduces Name of the World, an interactive EdTech platform that combines maps, quizzes, AI-assisted explanations, and verified geographic data to make learning the origins of place names more engaging. A pilot involving 347 students showed significant improvements in knowledge retention and positive feedback on the interactive learning approach.
2026-06-29 22:01:10
How are you, hacker?
🪐Want to know what's trending right now?:
The Techbeat by HackerNoon has got you covered with fresh content from our trending stories of the day! Set email preference here.
## The Man Who Got Himself Back  By @huckler [ 9 Min read ]
How I built PC Workman 1.8.0 - an offline system monitor that learns your machine - across a twelve-month, build-in-public year. The note and the story. Read More.
By @huckler [ 9 Min read ]
How I built PC Workman 1.8.0 - an offline system monitor that learns your machine - across a twelve-month, build-in-public year. The note and the story. Read More.

By @photonhq [ 4 Min read ] Hermes Agent now connects to iMessage through Photon, enabling AI agents to send and receive messages on any OS without a Mac. Read More.

By @nosana [ 7 Min read ] AI may be easy to prototype, but real products need reliable GPU access. See how decentralized compute and Nosana help builders move beyond demos. Read More.

By @assemblyai [ 6 Min read ] Compare AssemblyAI, OpenAI, Deepgram and ElevenLabs voice agent APIs on accuracy, pricing, latency, languages and production readiness. Read More.

By @ktdevjournal [ 4 Min read ] Cross-platform development is often treated as a technical problem, but the biggest risks usually come from production complexity. Read More.

By @penworth [ 7 Min read ] Andrew Isaacs discusses the current state of blockchain cybersecurity, smart contract auditing processes, and the practical realities projects face. Read More.

By @cloudsavant [ 9 Min read ] Learn to code without memorizing anything. Discover how engineers really code and build your first Python AI agent today. Read More.

By @unspected13 [ 27 Min read ] A deep dive into iOS 26 Foundation Models. Learn how to build free, on-device AI apps in Swift, master Tool Calling, @Generable, and avoid context limits. Read More.

By @drechi [ 5 Min read ] SentinelIQ turns security logs into attack graphs using UEBA scoring, correlation, and MITRE ATT&CK. Read More.

By @aditi-patodiya [ 11 Min read ] Discover why LLMs "forget" and how large enterprises build stateful context pipelines and memory architectures to solve AI amnesia in production environments. Read More.

By @cloudsavant [ 36 Min read ] RAG is the most important AI pattern in enterprise right now. This complete beginner's guide walks you through building a production-ready RAG. Read More.

By @veravoron [ 5 Min read ] Google AI is killing tech websites. A former media group owner explains why the classic online media model is broken and what is replacing it. Read More.

By @thomascherickal [ 35 Min read ] The 10 genuinely free AI inference providers in 2026 — no credit card ever. Gemini 3.5 Flash, GPT-OSS 120B, Devstral 2 and more. Step-by-step guide. Read More.

By @learn [ 11 Min read ] Learn everything you need to know about Fraud via these 81 free HackerNoon blog posts. Read More.

By @mayankc [ 7 Min read ] Discover why overly agreeable AI agents pose critical risks when executing real-world actions, and how to solve the growing problem of AI sycophancy Read More.

By @btcwire [ 8 Min read ] Today, markets respond almost instantly to economic data, central bank signals, earnings updates, geopolitical events, social sentiment, and liquidity changes a Read More.

By @obyte [ 6 Min read ] Lost hard drives, forgotten passwords, and secrets gone forever. These real crypto stories show how fortunes vanish. Take a look before it happens to you. Read More.

By @sebastianmartinez [ 10 Min read ] AI agent delegation needs identity propagation across humans, agents, runtime instances, tools, and policy decisions to preserve accountability. Read More.

By @rohitnagpal92 [ 12 Min read ] How event-driven data pipelines reduce latency, automate schema changes, and improve reliability across large-scale data platforms. Read More.

By @roma_armstrong [ 6 Min read ]
Boris Cherny doesn't prompt Claude anymore. He writes loops. Here's what that means for every engineer still optimizing their chat window prompts in 2026. Read More.
🧑💻 What happened in your world this week? It's been said that writing can help consolidate technical knowledge, establish credibility, and contribute to emerging community standards. Feeling stuck? We got you covered ⬇️⬇️⬇️
ANSWER THESE GREATEST INTERVIEW QUESTIONS OF ALL TIME
We hope you enjoy this worth of free reading material. Feel free to forward this email to a nerdy friend who'll love you for it.
See you on Planet Internet! With love,
The HackerNoon Team ✌️
.gif)
2026-06-29 22:01:05
We are back with another Company of the Week feature! Every week, we share an awesome tech brand from our tech company database, making their evergreen mark on the internet. This unique HackerNoon database ranks S&P 500 companies and top startups of the year alike.
This week, we are proud to present MEXC Learn, an educational platform designed to help users learn cryptocurrency trading, blockchain fundamentals, and Web3 concepts.
Founded in 2018, MEXC Learn is the educational arm of MEXC, a leading global cryptocurrency exchange dedicated to providing a secure and user-friendly platform that empowers both beginners and experienced traders to access the world of digital assets with ease.

\
:::tip Want to be featured on HackerNoon’s Company of the Week?
Join HackerNoon's Business Blogging Program!
:::
\
Don’t believe us? Well, where else would you find a single, comprehensive list of resources to help you getting up and running with all you need to master crypto trading? We’re talking News, Market Insights, Beginner’s guides!
\

Heck, there’s even a crypto glossary to search things like FOMO, To The Moon, and Diamond Hands!
And yes, IT’S FREE!
You can explore all articles, tutorials, and guides without any payment or subscription and no account is required to access MEXC Learn’s educational content.
However, if you wish to apply what you’ve learned through real trading, creating a free MEXC account will allow you to practice on the actual exchange.
\
MEXC Learn’s parent MEXC is the proud sponsor of the Decentralize AI Hackathon, a global competition organized to support developers and early-stage startups building the next generation of open AI infrastructure.
\

The hackathon is designed to advance alternatives to centralized AI systems by encouraging builders to create open infrastructure that supports decentralized compute, user-owned data, and greater transparency in AI development.
The hackathon will award participants and winners more than $50,000 in compute credits, storage credits, cash prizes and ecosystem rewards across two rounds.
MEXC will contribute $5,000 in USDT and MX Token ecosystem rewards for standout projects and selected winners across both rounds.
\
:::info The first round of the contest is open until Oct. 31, 2026—enter now!
:::
\
If you want developers to actually build with your technology - not just read about it - a HackerNoon Developer Hackathon is your move. They run 6 to 12 months, not a weekend sprint. A sustained, evergreen campaign that keeps your technology at the center of what builders are creating, with a dedicated landing page, newsletter promotions to 500K+ subscribers, social amplification to 1M+ followers, and SEO-indexed developer stories that compound over time.
\
:::tip Explore HackerNoon Hackathons
:::
\
As part of its mission, MEXC Learn has also been actively publishing on HackerNoon, sharing technical content to empower you to make informed investment decisions, manage risks effectively, and seize the best trading opportunities.

Check out MEXC Learn on HackerNoon:
\
HackerNoon’s Business Blogging Program is one of the many ways we help brands grow their reach and connect with the right audience. This program lets businesses publish content directly on HackerNoon to boost brand awareness and build SEO authority by tapping into ours.
Here’s what’s in it for you:
Full editorial support – we’ll help refine your story so it truly shines.
Multiple permanent placements – across HackerNoon, plus social media amplification.
Audio storytelling – your articles converted into audio format and distributed via RSS feeds.
Global reach – automatic translation into 12-76 languages.
SEO & domain authority boost – piggyback on HackerNoon’s trusted brand to strengthen your search rankings.
\
:::tip Join HackerNoon Business Bloging Program
:::
\
MEXC also recently partnered with HackerNoon on its “Futures Earn” campaign to reach out to audiences without having to rely on intrusive, cookie-based marketing campaigns.

\ Through the targeted ad campaign, Mexc is able to drive readers to Futures Earn, a financial product offered by MEXC for Futures users with the potential to earn 20% APR.
\

\ ▪️50,000+ tech tags across AI, Web3, Programming, Startups, Cybersecurity, Finance& more. \n ▪️Smart targeting: every story gets 8 tags + a parent category. \n ▪️Multi-format ads: banners, logos, newsletter, and audio. \n ▪️3x more clicks than elsewhere. \n ▪️Leads at unbeatable prices: CPM ~$7, CPC ~$5.
\
Learn How You Can Advertise to Your Specific Niche on HackerNoon
\
Whether you're an agency, a startup, or an established tech brand, we'll help you find the best way to get your story in front of the right audience.
\
:::tip Book a meeting with us!
:::
That's all this week, folks!
The HackerNoon Team
\
2026-06-29 22:00:57
Internet security encompasses measures used to protect data and information transmitted over the internet from unauthorized access, use, or disruption. It matters for maintaining privacy, protecting sensitive information, and ensuring the trustworthiness of online interactions.
 Credit card skimming occurs when someone places an electronic device on or near a credit card reader. This device captures and stores your credit card details.

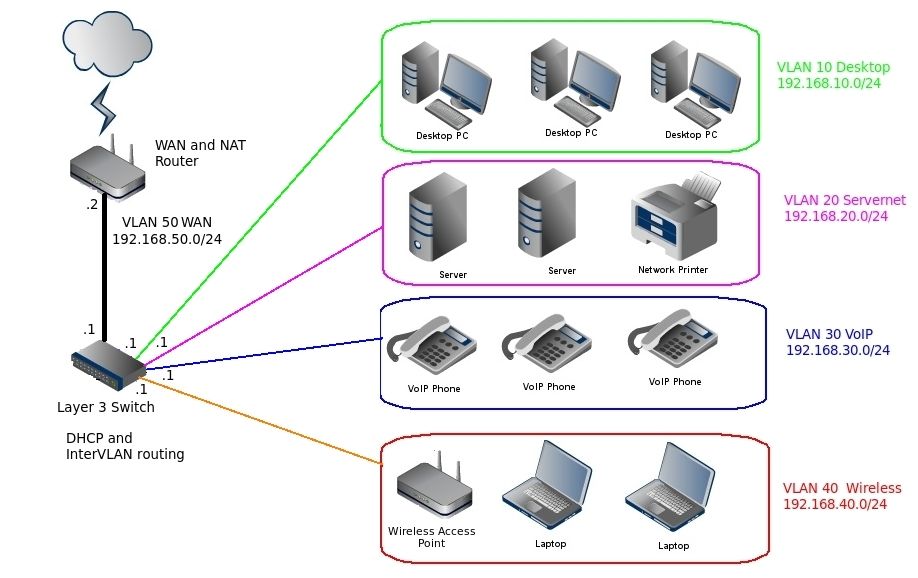 In today's complex business networks that comprise many virtual LAN's and subnets, a Layer 3 switch plays an important role in many systems. But do you need this on your network? Let's see.
 DNS is a protocol that translates human-friendly URLs into IP addresses and a DNS attack is when a hacker exploits vulnerabilities in the DNS service itself.
 Underwater cables carry most of the world's information, but they're vulnerable to cyberattacks and physical threats. Here's how undersea cables are protected.

 Why You Should Avoid Using Public WiFi
 Anti-malware software defends against new malware you may encounter while antivirus software scans for known viruses and searches for any known threats.
 Learn how free streaming and online free movies websites could negatively affect your security
 In this tech guide, we will cover the important details about DOCSIS 3.1 technology.
 Even though NFC appears to be so easy and convenient, it is not without its vulnerabilities, especially in regards to security.
 Is it possible to trace an IP ? To what extent does it reveal your physical location? How to prevent your IP from being tracked? Let's learn more about IP.
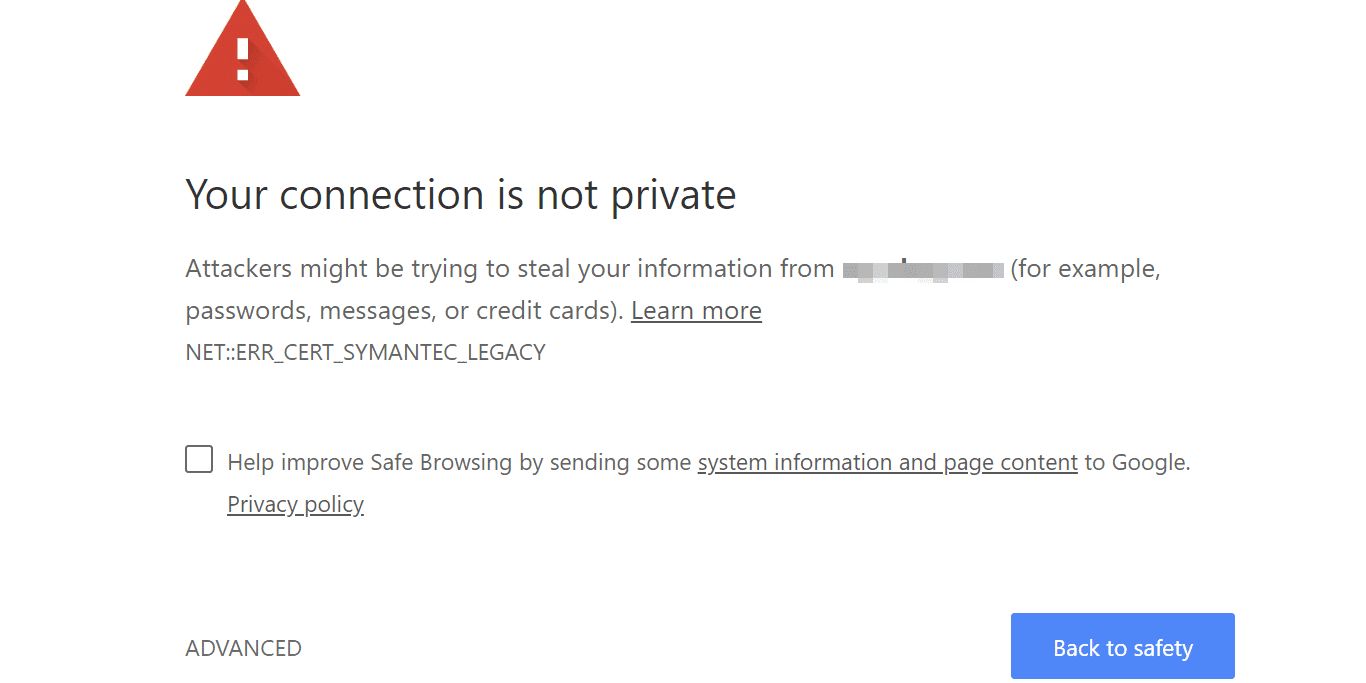 Each time you visit a website, your web browser (e.g., Chrome, Safari, or Firefox) first checks for the existence of one of two digital certificates
 Content Security Policy (CSP) is an added layer of security that helps to detect and mitigate certain types of attacks including XSS and data injection attacks.
 There is only one way to explain the dangers of the Internet to children: to be there with them. Talk about the good and the bad that that the internet offers.
 Enhance your Online Streaming Experience and improve your wifi connection with these easy fixes.
 Transport Layer Security, better known as SSL/TLS, is an encryption protocol designed to offer secure communications over the internet to improve user privacy.
 Interview with Link11 regarding their new DDoS report -- the state of DDoS attacks.
 As we adjust to life during a pandemic, two things have become clear: First, the internet is essential; second, the internet is full of dangers. Each of these dangers is different: They vary in the sort of attack they strike with, our familiarity with them, and the tools we can use to avert them. For example, viruses have been well-known for decades. Every PC is currently protected with antivirus software--and in many cases, it’s incorporated right into your operating system. Other types of internet threats, such as botnets, are newer, more difficult to detect, and less known to web users.
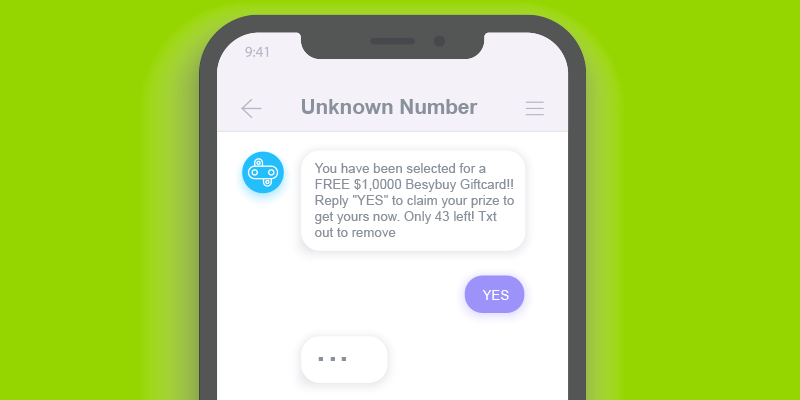 As the threat landscape encapsulating organizations and companies grows increasingly sophisticated, and harbors a growing number of threats and vulnerabilities- organizations are getting more accustomed to commonplace scams such as phishing.
 Trying to find the best VPN can be a daunting task, especially when there are so many to choose from. While free VPNs might seem like an easy way to dive into better security and bypass content locks, many of them are also likely to steal information and leave users in worse spots than they already were. Not every free VPN does this, but those wishing to truly be secure online will be much more comfortable with a paid service. Luckily, some of the best VPN services come with a free trial, and users would do very well to take advantage of them.
 A look at why vulnerability detection is important in the it space
 Here is a list of the top 7 access control system providers that offer feature-rich security systems for your business/organization.
 In 2020, we are now more connected to the internet than ever before, from having smart fridges, smart cars, and even RFID implants that can be placed under our skin.
 Proxies can be used for an IP covering, but other distinguishing features need something more. And all this because of a digital fingerprint revealing us.
 Understanding the common keywords used in the info-sec industry that are used in conjunction with that complicated OWASP Top 10 WAST
 We would like to take this opportunity to remind users about some good security practices when it comes to downloading and executing software.
 LDAP or Lightweight Directory Access Protocol is a methodology designed to read data in a directory, file or device. This is actually a directory access service which, for instance, can be used to provide information about a user who is trying to login as part of a single-sign-on, SSO process.
 MetaMask users are being targeted in a series of phishing attacks where hackers impersonate popular metaverse project websites.
 Using an Infrastructure-as-a-Service provider makes it easier to achieve and maintain compliance, but here are some caveats to consider.
 A selection of programs for online privacy. All of them will help you not to fall prey to hackers and keep your data safe.

 A fire broke out in the SK C&C Banqiao Data Center, Sanpingdong, Bantang District, South City, Gyeonggi do, South Korea, on October 15, at 3:19 p.m. local time.
 The cyber-world now accommodates billions of users. There are more than 4 billion internet users in the world today. It's just unfortunate that a large percentage of these users face cyber attacks from unknown sources. While some users are afraid of being attacked, others are ignorant of possible attacks. As an organisation or an individual that utilises the internet, it's a must to know some security tricks. If you're wondering what the tricks are, read on.
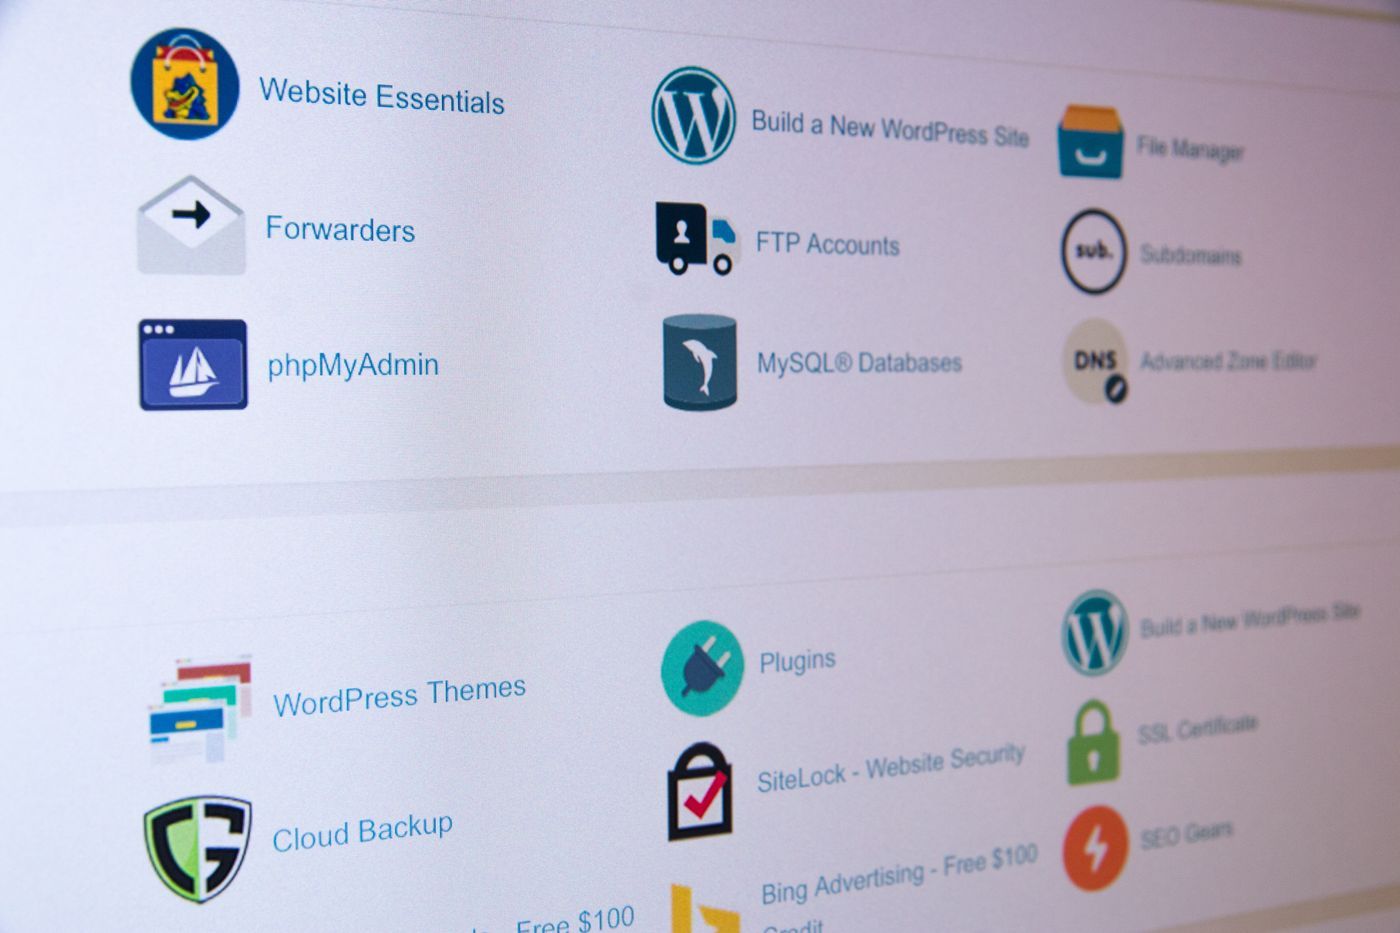
 Enhancing security for a website can save it from hackers and online attackers. Read this article about website security to learn more.
 Let’s take a look at the three key issues associated with Virtual Private Networks while questioning whether they’re really as private as we’re led to believe.
 Web security is the process of protecting systems, networks, programs, devices, and data from cyber-attacks. It aims to reduce or stop the risk of cyber-attacks and protect against the unauthorized hijacking of systems, networks, and technologies.
 This article's goal is to help you make these decisions to ensure the confidentiality and integrity communication between client and server.
 Cyber range simulations help create resiliency by enabling companies in an actual situation to stress-test through Cloud computing. With tabletop drills or classroom instructors we need immersive funds to support situational awareness in a way that is very difficult to duplicate. Cloud Simulation contributes to experience on-the-ground and provides various advantages, including statistical information, input from real-time experts, and cross-functional coaching. There are potentially many challenges with the on-site classrooms based on several experts:
 Web-based password managers have emerged as a response to the proliferation of web applications.
 In 2019, more than 627 million online records were comprised due to hacking and other types of cyber attacks. This is a pretty staggering number to anyone who has made an online transaction, but the amount of attacks that were stopped is much higher, so it’s worth some optimism. As COVID-19 has pushed many companies into the remote work world, online transactions and records are growing exponentially, and most experts believe that remote work will continue to be very popular even after stay-at-home orders get lifted and life goes back to some form of normal.
 Technology is evolving at an incredibly fast pace. An analog world wasn’t that long ago, when phones stayed on the wall, the internet was in its infancy, and seamless global connection seemed distant. Yet now we can summon cars from the mini computers in our pockets, jump on a real-time video call with someone across the world, and have our refrigerators order our groceries.
![]() An attack on the internet by a rogue nation would likely lead to new alliances, cybersecurity treaties, and agreements among other countries.
An attack on the internet by a rogue nation would likely lead to new alliances, cybersecurity treaties, and agreements among other countries.
 Data transfer is very important and it keeps happening almost every minute. As we chat on various social media applications or even like a post, there is a transfer of information that is happening. While we may not be too bothered about the way in which information and data are transferred from the receiver to the sender and vice-versa, we, of course, would be concerned about the safety of the data and information that is flowing on the internet and other forms of communication.
 Since we can't function without the internet these days, it is highly important to keep our digital identity secure.
 There are certain cyberattacks, like attackers trying to inject data from the front-end, that you can guard against with some regular JavaScript best practices.
 These days, reports of major data breaches happen so often that people are beginning to tune them out. After all, most people who have had their data stolen don't actually end up suffering any visible consequences. Therefore, it's all too easy to meet the news of each new security incident with a casual shrug.
 More than two thirds of the U.S. population is now stuck at home as more states are creating new restrictions to try to slow the spread of COVID-19. The internet is now being used more than ever as millions are turning to it as an alternative source of social connection, work, and entertainment. In Seattle, one of the cities in the U.S. that was hardest hit by the virus, internet traffic quickly began to rise - from January to March it has risen by an astounding 30%. Other U.S. ISPs are noticing huge spikes in WiFi calling, online gaming, and VPN usage across the country. With a huge number of increased active users, governments and companies alike are making moves to help Americans stay online. One of these steps is the FCC’s Keep Americans Connected pledge that over 70 telecom companies have signed stating that these companies will waive late fees and retain service even with lack of payment. Other companies are making public WiFi networks for students and remote workers. Comcast is setting up public hotspots for free use, Comcast and Spectrum are both offering 2 free months of access to low-income families, and AT&T is suspending broadband usage caps.
 You may ask, "My web browser already has a built-in password manager, why do I need to install a new one?" There's actually a number of good reasons to install a password manager.
 Learn everything you need to know about Internet Security via these 66 free HackerNoon stories.
 The future of the internet will come with more risks to our data privacy. Fortunately, Blockchain and Decentralized Identifiers can work together to protect.
 Viruses and trojans are common for Windows OS-based machines.
 Google wants to change a major part of web browsing by killing the URL, in parts though. After their first step was successful, here’s what they plan for the second step.
 IT Security protects your business against cyber threats. There are four types of IT Security: network security, end-point security, internet & cloud security.
 With the number of products available, it can be an uphill task to try to ensure robust network security and visibility. This, however, is a task that must be accomplished if you want to be competitive.
 9/26/2022: Top 5 stories on the Hackernoon homepage!
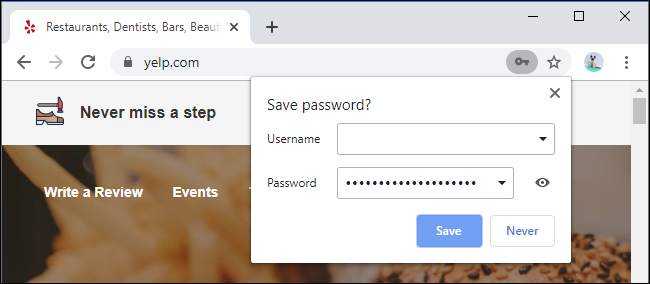
 Password managers are a convenient way to use strong, unique passwords everywhere. Another good thing about password managers is that they help protect you from malicious websites that attempt to "phish" passwords.

 Cyber Search Engines collect data across the whole internet and deliver it in a structured view.

 GIVE Nation marks Safer Internet Day with a conversation around privacy, particularly for parents.
 In this article, we will cover the origins of the transition, the differences between the two versions, and a sometimes-overlooked aspect of the transition
 We live our lives online these days – and given this simple fact, it should come as no surprise that cybersecurity is one of the fastest growing industries around, and one that’s critical to all other sectors. For those in the cryptocurrency industry, however, cybersecurity plays a more interesting role. That’s because, while cryptocurrency operations clearly need to enhance their own cybersecurity efforts, they’re also reliant on technology – blockchain – that other industries are using for their own security needs.
 ERP systems are complex solutions that handle business-critical processes and manage sensitive data. These factors alone are enough to make them an attractive target for cybercriminals. Despite it being common knowledge, businesses often opt for simpler and cheaper solutions that do not address the issue at the system level. Below is an in-depth look at the main factors that erode corporate cybersecurity and ways to prevent cyberattacks.
 The internet has ushered in a new era, and in too many ways to count, it has made our lives smoother, easier, and more modern.
 When it comes to your organizational security, there should be no stone left unturned. Unfortunately, many organizations fail to do this, as they aren’t even aware that there are unturned stones. Overlooked access rights are one of the most unnoticed security threats your organization can face—less of a stone and more of a somehow-overlooked, but ever-looming mountain.
 Windows 7 has recently joined the club of all Windows operating systems that Microsoft is no longer supporting with security updates. So if you're still running on Windows 7, pretty soon it's going to be full of unpatched security holes.
 Microsoft Edge has a new crapware blocker. But the thing is, it isn't enabled by default. The blocker is currently only available in Edge's beta version but it should be available for everyone using the Chromium-based Edge browser with the stable release of Edge 80 in early February.
Microsoft Edge has a new crapware blocker. But the thing is, it isn't enabled by default. The blocker is currently only available in Edge's beta version but it should be available for everyone using the Chromium-based Edge browser with the stable release of Edge 80 in early February.
Visit the /Learn Repo to find the most read blog posts about any technology.